Sponsored By

Indie Game Analytics 101Indie Game Analytics 101

Gamers are a tough crowd to please! Join me in understanding the psyche of the gamer.

Ben Chong, Blogger

November 21, 2011

7 Min Read
Game Developer logo in a gray background | Game Developer

Call it designer ego, but I think the world owes me something when I release a game. I mean, I spent like 5 months making this thing from scratch and now it's SO pretty and therefore everybody including my hero Jordan Mechner should be playing this.

Ignore everything I just said. Obviously the first version bombed and I went back to drawing cute levels on my napkins. Not GOOD enough. I still wasn't communicating with my players!

As an indie, I had a bunch of friends that helped playtest and shape the game into something that we *think players will like. I've gotten lots of "dude, this is awesome stuff"-type compliments, but these meant nothing when the game goes into the wild. 

Shiny new term

I heard about this new thing they call analytics. Turns out you could see what the player is doing in your game, track their behaviour, tweak it to give them a great experience!

I googled for "game analytics" and found this free cross-platform service called Playtomic . Holy cow: it tracks player events and presents it in a pretty GUI that even a noob like me can fathom. Perfect!


Background of my game

Private Joe is a 2d platform shooter. You play a soldier and try to eliminate enemies with various weapons. Gain coins, badges and powerups along the way. The web version is playable here

Here are some metrics that I'd like to share from my game's 30 levels.


Metric #1 - Beginnings and Deaths
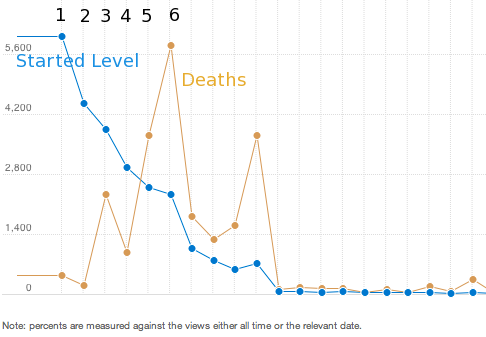
Started Levels vs Deaths

Started Levels vs Deaths


Blue line: steep player drop rates right after Levels 1 and 6. 

  • I knew immediately why most players left after Level 1 : the user flow was horrible! The missions menu was poorly designed. 

  • Most players couldn't progress beyond Level 6 because too many died there!


Orange line: most players get killed in levels 5, 6 and 10. 

Note: I excluded Level 10's deaths because it's a boss level. I shall write a separate article about boss level analytics soon

What I didn't expect was a high number of players dying in Levels 5 and 6. I had to investigate the cause of this! First thing that comes to mind is to record the x,y coordinates where players die frequently, and plot this over the level map. Enter heatmaps!


Metric #2 - Heatmaps

These were pretty easy to implement. Added the tracking code, uploaded the maps of Levels 5 and 6 as .PNG files, let Playtomic crunch the numbers.

Heatmap Level 6

Heatmap Level 6


Heatmap of Level 6

Some definitions:

StartPosition (Purple box) : Spawn position of player at start of level
WeaponBazooka : Collecting this unlocks the Bazooka for the player
RefuelStation: A checkpoint to emit messages ( not important here )
Ger_schutzer: Basic enemy soldier 
Ger_captain: Advanced enemy soldier
Ger_tank2: Advanced enemy tank

Notice the two colorful spots in Level 6. The first (300,200) is green-bluish, signaling a lower intensity of deaths. The killer is the 2nd, more colorful one near (600,200). What could be the reason?

The enemy tank packs a powerful punch. Getting hit by a tank shell gives 3x more damage than a regular bullet from an enemy soldier. Most players die fighting the 2nd tank, because their lives were reduced too much after fighting the 1st tank. Having two health packs after the 1st tank didn't seem to help much.

To reduce death numbers, I could add more healthpacks, reduce tank damage, remove the soldiers, remove the 2nd tank, etc... the options are endless for the game designer. Without analytics, I wouldn't have considered them!

Let's look at another heatmap

Heatmap Level 5

Heatmap Level 5


Heatmap of Level 5

This is a survival mission, requiring 60 seconds of not dying before winning. A wave of soldiers will approach from the right every X seconds, trying to force the player into a defensive position.

Some players get pushed back by the wave of enemy soldiers, causing deaths near (30,200).

Most players get killed between x=500 and x=650 (death zone). It makes sense: players are inclined to move to the right once the level loads. They couldn't beat the small tank just above the ledge, taking heavy fire in the process from incoming soldiers. To pour salt on the wound, I also had an enemy jet bomber drop bombs on the player's head every X seconds (avoidable of course). 

Too much action is concentrated in the death zone. Are tanks just too powerful? Should I just remove the jet bomber? Maybe increase the interval between enemy soldier rushes? All valid options to try out.

SummaryHeatmaps are awesome: you get to see where the action is, and tweak the game accordingly. My goal is to allow more players to progress through, so I made a few *secret decisions that would not affect other levels too drastically. 


Metric #3 - Favourite weapons to buy

Favourite weapons

Favourite weapons


Appears that the rifle (blue) is the favourite weapon, followed by the pistol (orange). Ironically, these were the two weapons I spent the LEAST development time making. I poured most time into making fancy Machine Gun recoils, Grenade mechanics and Bazooka explosion effects. Bummer.

Does that mean I wasted precious dev juice doing unimportant things? No. I just had to tweak the other 7 weapons to make sure they're utilized more. This can mean: increasing firepower for the big guns, reducing the prices ( players need coins to purchase weapons ) or giving players more "trial bullets" to begin with.

So now we have like a billion options to test against. This sets the scene for a future AB or multivariate testing. To do this, we can use the "GameVars" feature in Playtomic to selectively manipulate variables in-game. AB/multivariate testing is a science which deserves it's own article: more on this in future posts...


Metric #4 - Favourite menu items

Favourite menu items

Favourite menu items


I expected most players to click on the "Store" button and it turned out right! Players need to spend the coins gained from defeating enemies.

It appears that initially, the "Objectives" and "How to play" links got a lot of clicks because players were figuring out how to play. To placate this effect, I added a simple tutorial that pops up the moment players start Level 1.

Over time, more players cared about the Store and Inventory, possibly due to low bullet count. Opportunity rings! I could implement a 12 or 24-hour return bonus that awards free bullets if players come back to play. 


Metric #5 - Free vs. paid

Free vs paid

Free vs paid


As a kid, I always hated the "INSERT CREDIT TO CONTINUE" screen in arcades. Just couldn't afford all the quarters it took to finish Asterix and Obelix.

To encourage players with zero lives to continue playing, I offered them two choices:

  1. buy 8 lives for 80 coins, then respawn at the nearest checkpoint

  2. take the free life, but respawn all the way back at the starting point

"Free life" won by majority. The upside? Some people are willing to pay for lives, because it provides value: you don't need to respawn from the beginning, PLUS you won't get nagged at for at least the next 8 deaths!


Summary

So there you have it: 5 metrics out of the dozens that I am tracking. Done properly, analytics is an amazing tool that everyone can use - from community managers, to game designers, to upper management.

PS: i'm also interested in how you guys utilize analytics to track game performance. Feel free to comment!

Future articles

- AB/multivariate testing
- Heatmaps for dynamic maps (randomly generated) 
- Funnel testing
- Dynamic object tracking ( like bosses that have crazy movements )
- Your suggestions 

Read more about:

Featured Blogs

About the Author

Daily news, dev blogs, and stories from Game Developer straight to your inbox

You May Also Like