Trending
Opinion: How will Project 2025 impact game developers?
The Heritage Foundation's manifesto for the possible next administration could do great harm to many, including large portions of the game development community.
Stay up to date on the latest trends in crowdfunding with our monthly reports. This month, we report the data and take a look at the huge gap between the performance of unsuccessful and successful campaigns.


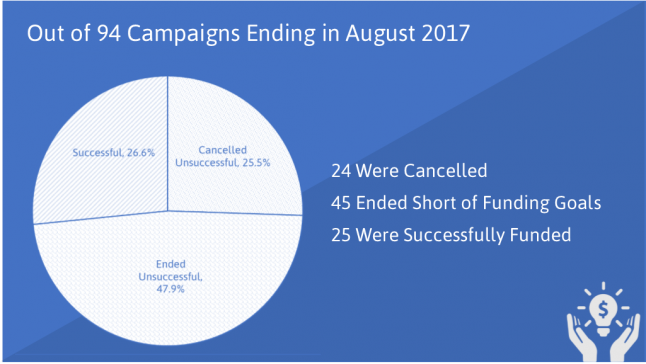
This shouldn't be a surprise to anyone following indie crowdfunding, but most campaigns fail. In August, 74% either ended without meeting their funding goals or were cancelled. Cancellations can happen for numerous reasons including DMCA takedowns, but most were cancelled at the last minute due to being far short of meeting funding goals. The lesson here, crowdfunding is not a sure thing. Plan your campaign carefully, and fine-tune every detail to improve the odds of success. Great campaigns aren't slapped together at the last minute.

In the month of August alone (on Kickstarter), backers pledged a total of $1.7 million to various video game campaigns. Interestingly, $1.6 million of this went to successful campaigns. So 94% of pledged money went to the 26% of campaigns that are successful. Let that sink in for a moment. The 74% of campaigns that fail only account for about 6% of pledged dollars. The gap between what successful campaings pull in and that of unsuccessful campaigns, is tremendous!
This gap continues as we examine average and median funding. Average funding for a successful campaign is about 4800% higher than that of unsuccessful campaigns. But averages can be skewed by outliers. Looking at median figures, median funds pledged is 22500% (not a typo) higher for successful campaigns than unsuccessful campaigns.

This pie chart shows the percent of funding at the labeled level. Notice that over 50% of unsuccessful campaigns only receive $0 to $50? Only 9% of unsuccessful campaigns generate more than $5,000 in pledged contributions.

Now compare the unsuccessful results to those of successful campaigns. Over 50% of successful campaigns raise more than $5,000! No successful campaigns raised less than $50, which is why you won't find that slice on this graph. So successful campaigns secure a tremendous amount of backer dollars compared to unsuccessful campaigns. The performance gap is enormous!

The huge performance gap continues when examaining the percent of the funding goal met. Obviously successful campaigns will have a funding goal percent at or above 100%. However, what is surprising is how low both average and median funding percents are for unsuccessful campaigns, 8% and 0% respectively.

This graph gives us a closer look at funding goal percentages for unsuccesful campaigns. There are two key takeaways: First, most unsuccessful campaigns never get passed 10% funded. Second, no unsuccessful campaigns exceeded 50% in funding. That second point bears repeating: No unsuccessful campaigns reached 60%, 70%, 80% or 90% funding. 50% was the max!

Just for fun, here is the same graph for successful campaigns. Most are between 100% to 150% funded, but there are a significant number that achieved 500%+ funding, which is impressive!
I think most would assume the gap between funding percent and pledged dollars would be somewhat close between unsuccessful and successful campaigns, but the data shows a vast difference here! There aren't very many campaigns that get close to being funded and fail by a few percent. For video games, in August at least, you either hit your funding target, or come up with less than 50% of your goal. It appears that if you hit above 50% funding during your crowdfunding campaign, you have a very good chance of successfully beating that goal by the time it ends. Still, more data needs to be analyzed to confirm this.
Perhaps there is some consumer psychology at work: Those campaigns with higher percents funded are more attractive to backers due to social proof. Maybe Kickstarters "magic" sorting algorithm has some influence here too. Or perhaps those campaigns are just that much better executed. Whatever the cause, successful campaigns attract the vast majority of attention. I'll continue to develop a better understanding of the potential causes and what separate success from failure on Kickstarter in future reports, so stay tuned!
If you enjoyed this article and want to see more like it, consider supporting me on Patreon. From the business and economics of games to using math to create smarter AI and more dynamic experiences, I have a lot in the pipeline I'd love to share. Help me continue my unholy crusade to harness the dark powers of math, data, logic and critical thinking and unlock the secrets of gaming business and design.
For this report I looked at Kickstarter campaigns ending in August 2017. Only campaigns in American currency (dollars) were included for ease of analysis. Data was collected using the phenomenal website KickTraq.com. If you seek information on past Kickstarter campaigns, this should be your first stop!
You May Also Like