Trending
Opinion: How will Project 2025 impact game developers?
The Heritage Foundation's manifesto for the possible next administration could do great harm to many, including large portions of the game development community.
The leading analysis column for NPD's North American game industry stats returns with a look at February 2009's trends, from Xbox 360 sales to software surprises.

[The leading analysis column for NPD's North American game industry stats returns with a look at February 2009's trends, from Xbox 360 sales to software surprises.]
Through February 2009, Nintendo's DS and Wii continued to dominate hardware sales while software for those systems continued to rule the top software lists, according to the latest NPD Group data released on Thursday.
Microsoft's Xbox 360 built momentum from its strong showing in January, and also made a strong showing in the top 20 software. Meanwhile Sony's platforms uniformly lost ground, although the exclusive Killzone 2 made a strong showing on the PlayStation 3 with only two days of sales.
Nintendo's Wii had strong sales again in February 2009, with 753,00 systems sold, or a rate of over 188,000 systems per week. Microsoft's Xbox 360 was Nintendo's strongest competitor with sales of 391,000 systems for the month or 97,750 per week.
When this generation of hardware was fully underway – at the end of November 2006 – the Xbox 360 enjoyed a full year lead while Nintendo and Sony were just getting their hardware out to the market. Before the Wii and PlayStation 3 launched, the Xbox 360 had 100% of the current generation console hardware base.
The graph below shows how each system's share of the hardware base has changed over time. (The data is given quarterly, to smooth out month-to-month and seasonal variations.)
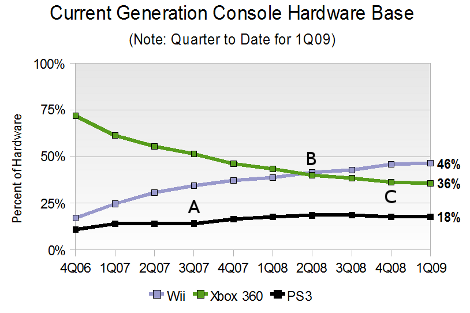
Points of interest are marked with letters on the graph.
A: Sony moves first on price, first with reduction of the 60GB system to $500, and then the introduction of the $400 model with a 40GB hard drive and no PlayStation 2 backward compatibility. Sony's marketshare begins to increase.
B: The Wii officially overtakes the Xbox 360 in hardware share.
C: Microsoft's price cut strategy begins to pay off, slowing the loss of marketshare to its competitors. PlayStation 3 share drops for the first time, from 19% to 18%.
As we near the end of the first quarter of 2009, the Wii stands within a few percentage points of the 50% mark. However, more robust sales of the Xbox 360 and modest (but flagging) sales of the PlayStation 3 have slowed the growth of the Nintendo consoles share, at least by this measure.
Microsoft often touts the Arcade model of the Xbox 360 and its $200 price as the sweet spot for hardware sales. This isn't all marketing guff. The system really has seen strong sales recently.
The three best selling months were December from 2008, 2007, and 2006 (in order of decreasing sales).
The next best months were the Novembers of 2008, 2007, and 2006 (again in decreasing sales). The seventh best month was September 2007, the month consumers bought over 3 million copies of Halo 3.
Which brings us to February 2009, the eighth best selling month for the Xbox 360.
Unlike the months ahead of it in this ranking, it is neither a holiday month nor a killer app launch month. Compared to February 2008, sales of the Xbox 360 were up 54%.
As a baseline, it helps to recall that the lowest point for Xbox 360 sales was in the Spring of 2006, when the system bottomed out at a mere 38,400 systems per week.
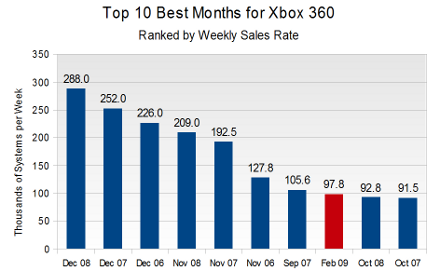
(Note: For the sake of a fair comparison, we use the weekly instead of the monthly figures. The NPD Group measures five weeks of sales for the last month of each quarter while all other months contain four weeks. To keep the calendar synchronized, NPD occasionally adds a week to a month. For example, January would normally have four weeks but in 2007 it had five.)
We reiterate and strengthen the point we made after the January 2009 data was released: Microsoft's Fall 2008 price cuts were effective and we expect to see higher Xbox 360 sales throughout the year.
The three non-holiday months after the price cuts were in full effect – September 2008 along with January and February 2009 – have averaged over 80,000 systems per week, which is is 57% higher than the average for the eight preceding non-holiday months.
Sony is under continuing pressure to reduce the price of its PlayStation 3, specifically pointing to year-on-year comparisons where the system is down. However, we believe there is another relevant comparison that tempers those figures.
Here is the standard view: Since November 2008, PS3 sales have been down each month, year-on-year, dropping from a total of 1.81 million units (Nov 2007 – Feb 2008) to 1.58 million (Nov 2008 – Feb 2009). That drop of 13% is significant, and worth noting.
However, as we noted above for the Xbox 360's fall-to-spring transition, we should also compare with the figures going into the holiday of 2008.
From July 2008 through September 2008 the PlayStation 3 averaged only 49,700 systems per week. (If we include October 2008, the average drifts down to 49,100 systems per week.)
Compare that sub-50,000 figure with the weekly averages after the holiday season: 50,800 in January and 69,000 in February.
Year-to-date, the system is averaging almost 60,000 systems per week, more than 20% higher than its pre-holiday averages.
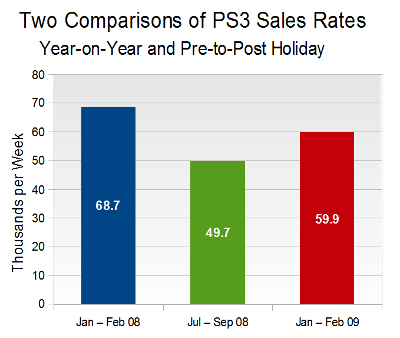
No doubt Sony wishes it were posting the same kind of PS3 sales figures that it managed at the beginning of 2008. But, given how slow sales were heading into Christmas of 2008, what explains the jump in sales afterward?
All signs outside the videogame industry point to consumers who are more strapped for cash today than they were in August and September of 2008, yet PlayStation 3 sales are 20% higher.
In 2007 and somewhat in 2008 Sony could point to its robust PSP and PS2 markets while the PS3 strove for footing. However, the PS2 is far down this year, and the PSP is appears to be slowing as well.
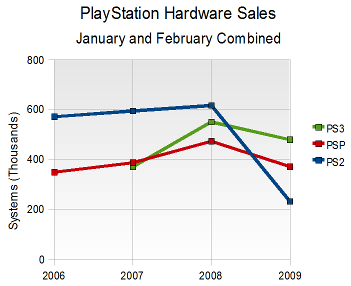
After increases for the beginnings of both 2007 and 2008, the PS2 has finally fallen off a cliff. Sales of the oldest active console on the market dropped from over 600,000 for the first two months of 2008 to just 232,000 for the beginning of 2009. While the PSP didn't suffer quite the same loss, a drop of 22% should not be shrugged off lightly.
While Sony could energize sales of all its systems with a price drop, the reasons for doing so are not so clear. For the PlayStation 3, the company may still be taking a loss – or perhaps breaking even – with each system sold.
With the company dedicated to profitability, it seems unlikely that the PlayStation 3 will get a price drop until well into the second quarter of this year. Mr. Michael Pachter of Wedbush Morgan Securities has said that he expects a mid-year price drop, which seems reasonable.
Until that time, Sony may opt to increase the value of the system with bundling rather than offer a true price cut.
For the PS2 and PSP, one must ask: What would a price drop accomplish other than increasing hardware sales and cutting the company's margin on profitable hardware?
Any consumer waiting to get a PS2 which it reaches $100, as opposed to $130, is cost-conscious enough to avoid expensive new software and opt instead for games from the giant pool of used games available at retailers like GameStop.
On the PSP side, software is already selling so poorly and new killer titles are so infrequent that Sony is possibly better keeping more profit from the hardware.
The top 20 software titles for the month of February 2009 are shown below. Regular readers will recognize several returning titles.
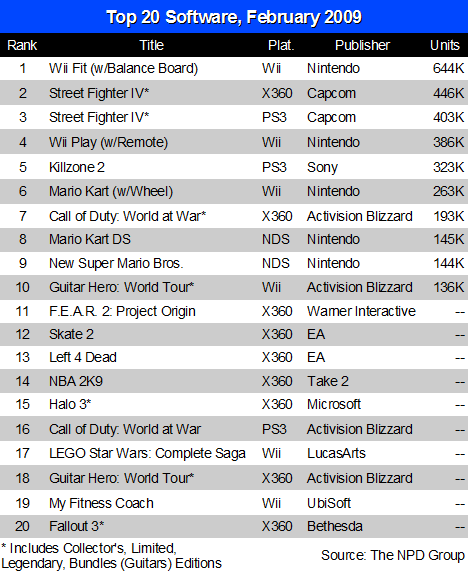
Nintendo's Wii Fit again took the #1 spot on the chart while the other Wii regulars – Wii Play and Mario Kart – took #4 and #6, respectively. If sales of these titles continue through April (and there is no immediate reason to suspect otherwise) they will have all three remained in the top 10 together for a full year.
Furthermore, February marks the first month of what may be Wii Play's third year in the regular top 10 charts.
The other big story in the top 20 this month is the strong showing by the Xbox 360 software lineup. Not only did the Xbox 360 version of Capcom's Street Fighter IV take the #2 spot for the month with 446,000 units (about 43,000 units ahead of its PlayStation 3 counterpart), but the system landed a total of nine titles in the top 20.
Along with recent hits like Call of Duty: World at War, Left 4 Dead, and Fallout 3, one of the system's biggest games, Halo 3, returned to the top 20 for the first time in many months.
Leading the software for Sony's PlayStation 3 this month was the long-awaited Killzone 2, which sold a big 323,000 units for only two days on the market.
The only other Sony-system games appearing in the top 20 were Street Fighter IV (#3) and Call of Duty: World at War (#16). No PlayStation 2 nor PlayStation Portable software reached into the top 20 in February 2009.
Older software appearing in the top 20 isn't new, but it does appear that it is becoming more common. Take Mario Kart for the Nintendo DS, which just made its fourth consecutive appearance in the top 20, while New Super Mario Bros. (also for the Nintendo DS) made its second return. Seven titles in the February 2009 top 20 are older than 9 months.
What to make of this trend? It would appear that robust hardware sales – originally on the Nintendo Wii and Nintendo DS, but now also on the Xbox 360 – are increasing sales of popular titles, even when those titles are quite old.
It seems likely that the top 20 in the coming months will continue to contain the regular Wii titles, a version of Guitar Hero: World Tour (probably also for the Wii), and at least one version of Call of Duty: World at War.
The Xbox 360 exclusive episode, The Lost and the Damned, for Grand Theft Auto 4 was released during February but did not appear in the top 20 games listed above. Since the game was distributed via Microsoft's Xbox Live service, it was not sold as a physical product in stores and thus wasn't tracked by the NPD Group like other game software.
However, retail cards were available which entitled buyers to download a copy of The Lost and the Damned off of Xbox Live, much like a points card. These cards were tracked by NPD, but were listed as an accessory – not a game.
And that's where things get quite interesting. These cards did not appear in the top 10 accessories for the month of February 2009. We were assured early last week that if the cards sold well enough that they would appear on that list.
Instead, the same 10 accessories made up the February 2009 chart as had previously made up the January 2009 chart. That suggests that the retail cards for The Lost and the Damned were actually a small part of the sales that Microsoft has claimed for the add-on content.
Michael Pachter of Wedbush Morgan Securities estimates that the episode sold about 1 million copies during the month. Had it been a retail package, and sold equally well, it would have been the top selling game for the month.
What we find puzzling is the comment by Microsoft's Aaron Greenberg in an interview on Gamasutra from Thursday of last week. Referring to The Lost and the Damned he said “If that content was sold at retail, it would be one of the best sellers across all platforms,” and then noted that it “ would have outsold Killzone 2.”
As a dig at a competitor's biggest title for the quarter, this is an effective piece of smack talk. But had The Lost and the Damned been the top selling game for the month, why not tout that fact instead?
For the moment we know that the NPD Group is tracking sales of games online in some fashion, but it has declined to elaborate further. At the very least we will watch with interest as the industry shifts toward online distribution and tracking becomes easier for distributors but less visible to the public.
[As always, many thanks to the NPD Group for its monthly release of the videogame industry data. Additional credit is due to Mr. Michael Pachter, analyst for Wedbush Morgan Securities, for his industry analysis. Moreover, thanks to my colleagues at Gamasutra and on NeoGAF for many helpful discussions.]
Read more about:
FeaturesYou May Also Like