Trending
Opinion: How will Project 2025 impact game developers?
The Heritage Foundation's manifesto for the possible next administration could do great harm to many, including large portions of the game development community.

Featured Blog | This community-written post highlights the best of what the game industry has to offer. Read more like it on the Game Developer Blogs or learn how to Submit Your Own Blog Post
Part 1 provided background information and practical tips on C# memory managment in Unity. This second part, also aimed at 'intermediate'-level developers, discusses how you can uses the Unity Profiler and disassemblers to find unwanted heap allocations.

[The first installment of this three-part series discussed the basics of memory management in .NET/Mono and Unity, and offered some tips for avoiding unnecessary heap allocations. The third dives into object pooling. All parts are intended primarily for 'intermediate'-level C# developers.]
Let's now take a close look at two paths to finding unwanted heap allocations in your project. The first path - the Unity profiler - is almost ridiculously easy to use, but has the not-so-minor drawback of costing a considerable amount of money, as it only comes with Unity's commercial 'Pro' version. The second path involves disassembling your .NET/Mono assemblies into Common Intermediate Language (CIL) and inspecting them afterwards. If you've never seen disassembled .NET code before, read on, it's not hard and it's also free and extremely educational. Below, I intend to teach you just enough CIL so you can investigate the real memory allocation behavior of your own code.
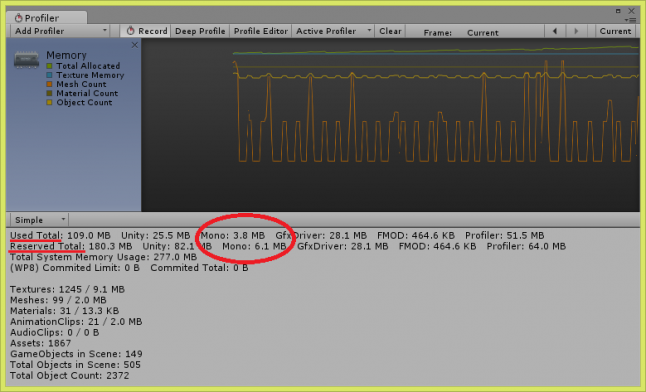
Unity's excellent profiler is chiefly geared at analyzing the performance and the resource demands of the various types of assets in your game: shaders, textures, sound, gameobjects, and so on. Yet the profiler is equally useful for digging into the memory-related behavior of your C# code - even of external .NET/Mono assemblies that don't reference UnityEngine.dll! In the current version of Unity (4.3), this functionality isn't accessible from the Memory profiler but from the CPU profiler. When it comes to your C# code, the Memory profiler only shows you the Total size and the Used amount of the Mono heap.

This is too coarse to allow you to see if you have any memory leaks stemming from your C# code. Even if you don't use any scripts, the 'Used' size of the heap grows and contracts continuously. As soon as you do use scripts, you need a way to see where allocations occur, and the CPU profiler gives you just that.
Let's look at some example code. Assume that the following script is attached to some GameObject.
using UnityEngine;
using System.Collections.Generic;

public class MemoryAllocatingScript : MonoBehaviour
{
    void Update()
    {
        List<int> iList = new List<int>(new int[] { 072, 101,
            108, 108, 111, 032, 119, 111, 114, 108, 100, 033 });
        string result = "";

        foreach (int i in iList.ToArray())
            result += ((char)i).ToString();

        Debug.Log(result);
    }
}
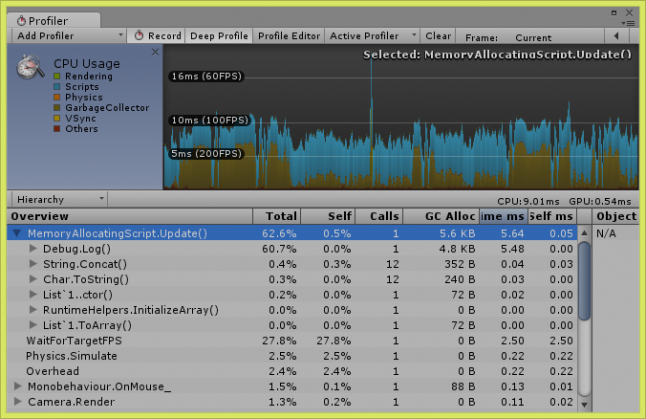
All it does is build a string ("Hello world!") from a bunch of integers in a circuitous manner, making some unnecessary allocations along the way. How many? I'm glad you asked, but as I'm lazy, let's just look at the CPU profiler. With "Deep Profile" checked at the top of the window, it traces the call tree as deeply as it can at every frame.

As you can see, heap memory is allocated at five different places during our Update(). The initialization of the list, it's redundant conversion to an array in the foreach loop, the conversion of each number into a string and the concatenations all require allocations. Interestingly, the mere call to Debug.Log() also allocates a huge chunk of memory - something to keep in mind even if it's filtered out in production code.
If you don't have Unity Pro, but happen to own a copy of Microsoft Visual Studio, note that there are alternatives to the Unity Profiler which have a similar ability to drill into the call tree. Telerik tells me that their JustTrace Memory profiler has similar functionality (see here). However, I do not know how well it replicates Unity's ability to record the call tree at each frame. Furthermore, although remote-debugging of Unity projects in Visual Studio (via UnityVS, one of my favorite tools) is possible, I haven't succeeded in bringing JustTrace to profile assemblies that are called by Unity.
If you already own a .NET/Mono disassembler, fire it up now, otherwise I can recommend ILSpy. This tool is not only free, it's also clean and simple, yet happens to include one specific feature which we need further below.
You probably know that the C# compiler doesn't translate your code into machine language, but into the Common Intermediate Language. This language was developed by the original .NET team as a low-level language that incorporates two features from higher-level languages. On one hand, it is hardware-independent, and on the other, it includes features that might best be called 'object-oriented', such as the ability to refer to modules (other assemblies) and classes.
CIL code that hasn't been run through a code obfuscator is surprisingly easy to reverse-engineer. In many cases, the result is almost identical to the original C# (VB, ...) code. ILSpy can do this for you, but we shall be satisfied to merely disassemble code (which ILSpy achieves by calling ildasm.exe, which is part of .NET/Mono). Let's start with a very simple method that adds two integers.
int AddTwoInts(int first, int second)
{
    int result = first + second;

    return result;
}
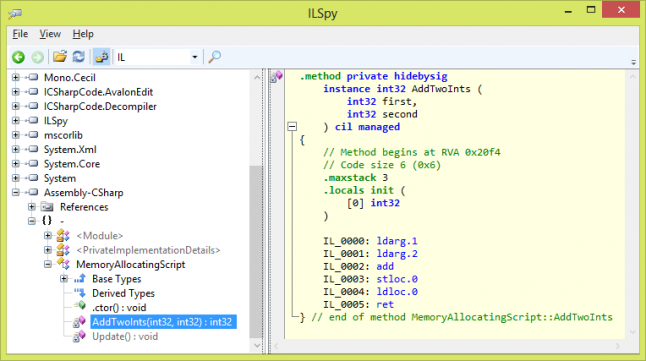
If you wish, you can paste this code into the MemoryAllocatingScript.cs file from above. Then make sure that Unity compiles it, and open the compiled library Assembly-Csharp.dll in ILSpy (the library should be in the directory Library\ScriptAssemblies of your Unity project). If you select the AddTwoInts() method in this assembly, you'll see the following.

Except for the blue keyword hidebysig, which we can ignore, the method signature should look quite familiar. To get the gist of what happens in the method body, you need to know that CIL thinks of your computer's CPU as a stack machine as opposed to a register machine. CIL assumes that the CPU can handle very fundamental, mostly arithmetic instructions such as "add two integers", and that it can also handle random access of any memory address. CIL also assumes that the CPU doesn't perform arithmetic directly 'on' the RAM, but needs to load data into the conceptual 'evaluation stack' first. (Note that the evaluation stack has nothing to do with the C# stack that you know by now. The CIL evaluation stack is just an abstraction, and presumed to be small.) What happens in lines IL_0000 to IL_0005 is this:
The two integer parameters get pushed on the stack.
add get's called and pops the first two items from the stack, automatically pushing it's result back on the stack.
Lines 3 and 4 can be ignored because they would be optimized away in a release build.
The method returns the first value on the stack (the added result).
The beauty of CIL-code is that it doesn't conceal heap allocations. Instead, heap allocations can occur in exactly the following three instructions, visible in your disassembled code.
newobj <constructor>: This creates an uninitialized object of the type specified via the constructor. If the object is a value type (struct etc.), it is created on the stack. If it is a reference typ (class etc.) it lands on the heap. You always know the type from the CIL code, so you can tell easily where the allocation occurs.
newarr <element type>: This instruction creates a new array on the heap. The type of elements is specified in the a parameter.
box <value type token>: This very specialized instruction performs boxing, which we already discussed in the first part of this series.
Let's look at a rather contrived method that performs all three types of allocations.
void SomeMethod()
{
    object[] myArray = new object[1];
    myArray[0] = 5;

    Dictionary<int, int> myDict = new Dictionary<int, int>();
    myDict[4] = 6;

    foreach (int key in myDict.Keys)
        Console.WriteLine(key);
}
The amount of CIL code generated from these few lines is huge, so I'll just show the key parts here:
IL_0001: newarr [mscorlib]System.Object
...
IL_000a: box [mscorlib]System.Int32
...
IL_0010: newobj instance void class [mscorlib]System.
    Collections.Generic.Dictionary'2<int32, int32>::.ctor()
...
IL_001f: callvirt instance class [mscorlib]System.
    Collections.Generic.Dictionary`2/KeyCollection<!0, !1>
    class [mscorlib]System.Collections.Generic.Dictionary`2<int32,
    int32>::get_Keys()
As we already suspected, the array of objects (first line in SomeMethod()) leads to a newarr instruction. The integer '5', which is assigned to the first element of this array, needs a box. The Dictionary<int, int> is allocated with a newobj.
But there is a fourth heap allocation! As I mentioned in the first post, Dictionary<K, V>. KeyCollection is declared as a class, not a struct. An instance of this class is created so that the foreach loop has something to iterate over. Unfortunately, the allocation happens in a special getter method for the Keys field. As you can see in the CIL code, the name of this method is get_Keys(), and its return value is a class. Looking through this code, you might therefore already suspect that something fishy is going on. But to see the actual newobj instruction that allocates the KeyCollection instance, you have to visit the mscorlib assembly in ILSpy and navigate to get_Keys().
As a general strategy for finding memory leaks, you can create a CIL-dump of your entire assembly by pressing Ctrl+S (or File -> Save Code) in ILSpy. You then open this file in your favourite text editor and search for the three mentioned instructions. Getting at allocations that occur in other assemblies can be hard work, though. The only strategy I know is to look carefully through your C# code, identify all external method calls, and inspect their CIL code one-by-one. How do you know when you're done? Easy: your game can run smoothly for hours, without producing any performance spikes due to garbage collection.
***
PS: In the previous post, I promised to show you how you could verify the version of Mono installed on your system. With ILSpy installed, nothing's easier than that. In ILSpy, click Open and find your Unity base directory. Navigate to Data/Mono/lib/mono/2.0 and open mscorlib.dll. In the hierarchy, go to mscorlib/-/Consts, and there you'll find MonoVersion as a string constant.
Read more about:
Featured BlogsYou May Also Like