Trending
Opinion: How will Project 2025 impact game developers?
The Heritage Foundation's manifesto for the possible next administration could do great harm to many, including large portions of the game development community.

Featured Blog | This community-written post highlights the best of what the game industry has to offer. Read more like it on the Game Developer Blogs or learn how to Submit Your Own Blog Post
The Vanishing of Ethan Carter, with its rich visuals and a graphics workload somewhat uncommon for Unreal Engine 4, has been a difficult case for attaining VR perf targets. This is a story of scraping off frame render time, microsecond by microsecond.

Originally posted on my blog on Medium.
As a game with very rich visuals, The Vanishing of Ethan Carter (available for the Oculus Rift and Steam VR) has been a difficult case for hitting the VR performance targets. The fact that its graphics workload is somewhat uncommon for Unreal Engine 4 (and, specifically, largely dissimilar to existing UE4 VR demos) did not help. I have described the reasons for that at length in a previous post; the gist of it, however, is that The Vanishing of Ethan Carter’s game world is statically lit in some 95% of areas, with dynamic lights appearing only in small, contained, indoors.
Important note: Our (The Astronauts’) work significantly pre-dates Oculus VR’s UE4 renderer. If we had it at our disposal back then, I would probably not have much to do for this port; but as it were, we were on our own. That said, I highly recommend the aforementioned article and code, especially if your game does not match our rendering scenario, and/or if the tricks we used simply do not work for you.
Although the studied case is a VR title, the optimizations presented are mostly concerned with general rendering and may be successfully applied to other titles; however, they are closely tied to the UE4 and may not translate well to other game engines.
There are Github links in the article. Getting a 404 error does not mean the link is dead — you need to have your Unreal Engine and Github accounts connected to see UE4 commits.
To whet the reader’s appetite, let us compare the graphics profile and timings of a typical frame in the PS4/Redux version to a corresponding one from the state of the VR code on my last day of work at The Astronauts:
Both profiles were captured using the UE4Editor -game -emulatestereo command line in a Development configuration, on a system with an NVIDIA GTX 770 GPU, at default game quality settings and 1920x1080 resolution (960x1080 per eye). Gameplay code was switched off using the PAUSE console command to avoid it affecting the readouts, since it is out of the scope of this article.
As you can (hopefully) tell, the difference is pretty dramatic. While a large part of it has been due to code improvements, I must also honour the art team at The Astronauts — Adam Bryła, Michał Kosieradzki, Andrew Poznański, and Kamil Wojciekiewicz have all made a brilliant job of optimizing the game assets!
This dead-simple optimization algorithm that I followed set a theme for the couple of months following the release of Ethan Carter PS4, and became the words to live by:
Profile a scene from the game.
Identify expensive render passes.
If the feature is not essential for the game, switch it off.
Otherwise, if we can afford the loss in quality, turn its setting down.
The beginnings of the VR port were humble. I decided to start the transition from the PS4/Redux version with making it easier to test our game in VR mode. As is probably the case with most developers, we did not initially have enough HMDs for everyone in the office, and plugging them in and out all the time was annoying. Thus, I concluded we needed a way to emulate one.
Turns out that UE4 already has a handy -emulatestereo command line switch. While it works perfectly in game mode, it did not enable that Play in VR button in the editor. I hacked up the FInternalPlayWorldCommandCallbacks::PlayInVR_*() methods to also test for the presence of FFakeStereoRenderingDevice in GEngine->StereoRenderingDevice, apart from just GEngine->HMDDevice. Now, while this does not accurately emulate the rendering workload of a VR HMD, we could at least get a rough, quick feel for stereo rendering performance from within the editor, without running around with a tangle of wires and connectors. And it turned out to be good enough for the most part.
While trying it out, Andrew, our lead artist, noticed that game tick time is heavily impacted by having miscellaneous editor windows open. This is most probably the overhead from the editor running a whole lot of Slate UI code. Minimizing all the windows apart from the main frame, and setting the main level editor viewport to immersive mode seemed to alleviate the problem, so I automated the process and added a flag for it to ULevelEditorPlaySettings. And so, the artists could now toggle it from the Editor Preferences window at their own leisure.
These changes, as well as several of the others described in this article, may be viewed in my fork of Unreal Engine on Github (reminder: you need to have your Unreal Engine and Github accounts connected to see UE4 commits).
Digging for information on UE4 in VR, I discovered that Nick Whiting and Nick Donaldson from Epic Games have delivered an interesting presentation at Oculus Connect, which you can see below.
Around the 37 minute mark is a slide which in my opinion should not have been a “bonus”, as it contains somewhat weighty information. It made me realize that, by default, Unreal’s renderer does a whole bunch of things which are absolutely unnecessary for our game. I had been intellectually aware of it beforehand, but the profoundness of it was lost on me until that point. Here is the slide in question:
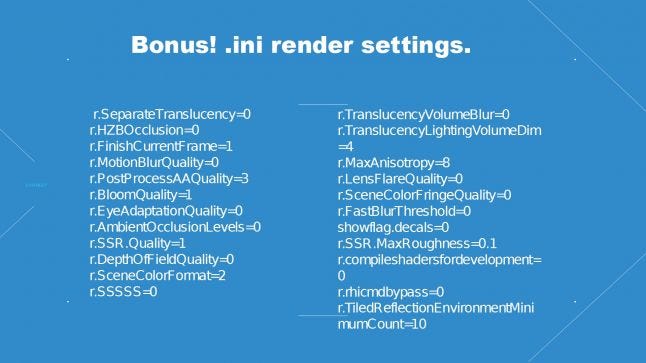
I recommend going over every one of the above console variables in the engine source and seeing which of their values makes most sense in the context of your project. From my experience, their help descriptions are not always accurate or up to date, and they may have hidden side effects. There are also several others that I have found useful and will discuss later on.
It was the first pass of optimization, and resulted in the following settings — an excerpt from our DefaultEngine.ini:
[SystemSettings]
r.TranslucentLightingVolume=0
r.FinishCurrentFrame=0
r.CustomDepth=0
r.HZBOcclusion=0
r.LightShaftDownSampleFactor=4
r.OcclusionQueryLocation=1
[/Script/Engine.RendererSettings]
r.DefaultFeature.AmbientOcclusion=False
r.DefaultFeature.AmbientOcclusionStaticFraction=False
r.EarlyZPass=1
r.EarlyZPassMovable=True
r.BasePassOutputsVelocity=FalseMay I remind you that Ethan Carter is a statically lit game; this is why we could get rid of translucent lighting volumes and ambient occlusion (right with its static fraction), as these effects were not adding value to the game. We could also disable the custom depth pass for similar reasons.
On most other occasions, though, the variable value was a result of much trial and error, weighing a feature’s visual impact against performance.
One such setting is r.FinishCurrentFrame, which, when enabled, effectively creates a CPU/GPU sync point right after dispatching a rendering frame, instead of allowing to queue multiple GPU frames. This contributes to improving motion-to-photon latency at the cost of performance, and seems to have originally been recommended by Epic (see the slide above), but they have backed out of it since (reminder: you need to have your Unreal Engine and Github accounts connected to see UE4 commits). We have disabled it for Ethan Carter VR.
The variable r.HZBOcclusion controls the occlusion culling algorithm. Not surprisingly, we have found the simpler, occlusion query-based solution to be more efficient, despite it always being one frame late and displaying mild popping artifacts. So do others.
Related to that is the r.OcclusionQueryLocation variable, which controls the point in the rendering pipeline at which occlusion queries are dispatched. It allows balancing between more accurate occlusion results (the depth buffer to test against is more complete after the base pass) against CPU stalling (the later the queries are dispatched, the higher the chance of having to wait for query results on the next frame). Ethan Carter VR’s rendering workload was initially CPU-bound (we were observing randomly occurring stalls several milliseconds long), so moving occlusion queries to before base pass was a net performance gain for us, despite slightly increasing the total draw call count (somewhere in the 10–40% region, for our workload).

Left eye taking up more than twice the time? That is not normal.
Have you noticed, in our pre-VR profile data, that the early Z pass takes a disproportionately large amount of time for one eye, compared to the other? This is a tell-tale sign that your game is suffering from inter-frame dependency stalls, and moving occlusion queries around might help you.
For the above trick to work, you need r.EarlyZPass enabled. The variable has several different settings (see the code for details); while we shipped the PS4 port with a full Z prepass (r.EarlyZPass=2) in order to have D-buffer decals working, the VR edition makes use of just opaque (and non-masked) occluders (r.EarlyZPass=1), in order to conserve computing power. The rationale was that while we end up issuing more draw calls in the base pass, and pay a bit more penalty for overshading due to the simpler Z buffer, the thinner prepass would make it a net win.
We have also settled on bumping r.LightShaftDownSampleFactor even further up, from the default of 2 to 4. This means that our light shaft masks’ resolution is just a quarter of the main render target. Light shafts are very blurry this way, but it did not really hurt the look of the game.
Finally, I settled on disabling the “new” (at the time) UE 4.8 feature of r.BasePassOutputsVelocity. Comparing its performance against Rolando Caloca’s hack of injecting meshes that utilize world position offset into the velocity pass with previous frame’s timings (which I had previously integrated for the PS4 port to have proper motion blur and anti-aliasing of foliage), I found it simply outperformed the new solution in our workload.
If you are not interested in failures, feel free to skip to the next section (Stereo instancing…).
Several paragraphs earlier I mentioned stalls in the early Z prepass. You may have also noticed in the profile above that our draw time (i.e. time spent in the render thread) was several milliseconds long. It was a case of a Heisenbug: it never showed up in any external profilers, and I think it has to do with all of them focusing on isolated frames, and not sequences thereof, where inter-frame dependencies rear their heads.
Anyway, while I am still not convinced that the suspicious prepass GPU timings and CPU draw timings were connected, I took to the conventional wisdom that games are usually CPU-bound when it comes to rendering. Which is why I took a look at the statistics that UE4 collects anddisplays, searching for something that could help me deconstruct the draw time. This is the output of STAT INITVIEWS, which shows details of visibility culling performance:
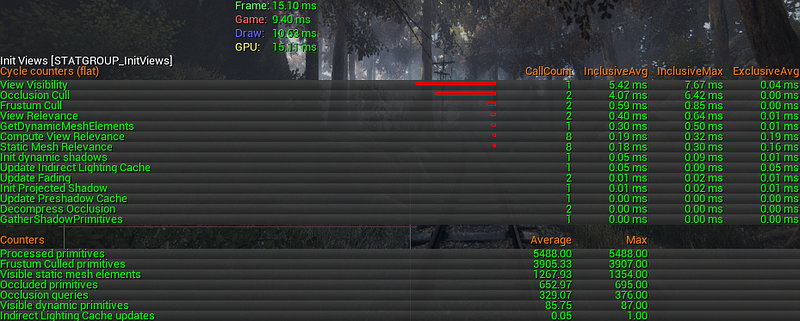
Output of STAT INITVIEWS in the PS4/Redux version.
Whoa, almost 5 ms spent on frustum and occlusion culling! That call count of 2 was quite suggestive: perhaps I could halve this time by sharing the visible object set data between eyes?
To this end, I had made several experiments. There was some plumbing required to get the engine not to run the view relevance code for the secondary eye and use the primary eye’s data instead. I had added drawing a debug frustum to the FREEZERENDERING command to aid in debugging culling using a joint frustum for both eyes. I had improved the DrawDebugFrustum() code to better handle the inverse-Z projection matrices that UE4 uses, and also to allow a plane set to be the data source. Getting one frustum culling pass to work for both eyes was fairly easy.
But occlusion culling was not.
For performance reasons mentioned previously, we were stuck with the occlusion query-based mechanism (UE4 runs a variant of the original technique). It requires an existing, pre-populated depth buffer to test against. If the buffer does not match the frustum, objects will be incorrectly culled, especially at the edges of the viewport.
There seemed to be no way to generate a depth buffer that could approximate the depth buffer for a “joint eye”, short of running an additional depth rendering pass, which was definitely not an option. So I scrapped the idea.
Many months and a bit more experience later, I know now that I could have tried reconstructing the “joint eye” depth buffer via reprojection, possibly weighing in the contributions of eyes according to direction of head movement, or laterality; but it’s all over but the shouting now.
And at some point, some other optimization — and I must admit I never really cared to find out which one, I just welcomed it — made the problem go away as a side effect, and so it became a moot point:
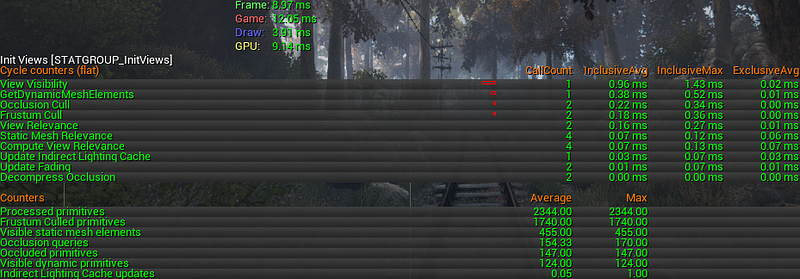
Output of STAT INITVIEWS in the VR version.
Epic have developed the feature of instanced stereo rendering for UE 4.11. We had pre-release access to this code courtesy of Epic and we had been looking forward to testing it out very eagerly.
It turned out to be a disappointment, though.
First off, the feature was tailored quite specifically to the Bullet Train UE4 VR demo.
Note that this demo uses dynamic lighting and has zero instanced foliage in it. Our game was quite the opposite. And the instanced foliage would not draw in the right eye. It was not a serious bug; evidently, Epic focused just on the features they needed for the demo, which is perfectly understandable, and the fix was easy.
But the worst part was that it actually degraded performance. I do not have that code laying around anymore to make any fresh benchmarks, but from my correspondence with Ryan Vance, the programmer at Epic who prepared a code patch for us (kudos to him for the initiative!):
Comparing against a pre-change build reveals a considerable perf hit: on foliage-less scenes (where we’ve already been GPU-bound) we experience a ~0.7 ms gain on the draw thread, but a ~0.5 ms loss on the GPU.
Foliage makes everything much, much worse, however (even after fixing it). Stat unit shows a ~1 ms GPU loss with vr.InstancedStereo=0 against baseline, and ~5 ms with vr.InstancedStereo=1!
Other UE4 VR developers I have spoken to about this seem to concur. There is also a thread at the Unreal forums with likewise complaints. As Ryan points out, this is a CPU optimization, which means trading CPU time for GPU time. I scrapped the feature for Ethan Carter VR — we were already GPU-bound for most of the game by that point.
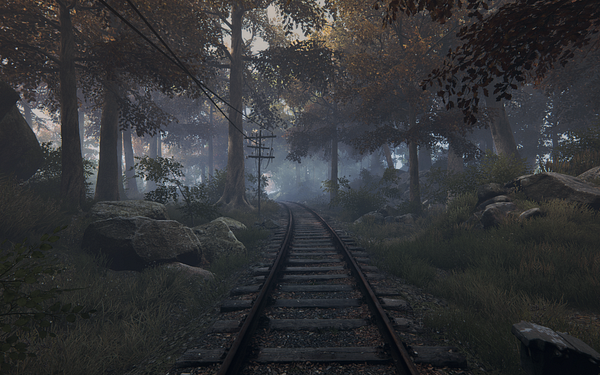
The problematic opening scene.
At a point about two-thirds into the development, we had started to benchmark the game regularly, and I was horrified to find that the very opening scene of the game, just after exiting the tunnel, was suffering from poor performance. You could just stand there, looking forward and doing nothing, and we would stay pretty far from VR performance targets. Look away, or take several steps forward, and we were back under budget.
A short investigation using the STAT SCENERENDERING command showed us that primitive counts were quite high (in the 4,000–6,000 region). A quick look around using the FREEZERENDERING command did not turn up any obvious hotspots, though, so I took to the VIS command. The contents of the Z-buffer after pre-pass (but before the base pass!) explained everything.
At the beginning of the game, the player emerges from a tunnel. This tunnel consists of the wall mesh and a landscape component (i.e. terrain tile) that has a hole in it, which resulted in the entire component (tile) being excluded from the early Z-pass, allowing distant primitives (e.g. from the other side of the lake!) to be visible “through” large swaths of the ground. This was also true of components with traps in them, which are also visible in this scene.
I simply special-cased landscape components to be rendered as occluders even when they use masked materials (reminder: you need to have your Unreal Engine and Github accounts connected to see UE4 commits). This cut us from several hundred to a couple thousand draw calls in that scene, depending on the exact camera location.
Still not happy with the draw call count, I took to RenderDoc. It has the awesome render overlay feature that helps you quickly identify some frequent problems. In this case, I started clicking through occlusion query dispatch events in the frame tree with the depth test overlay enabled, and a pattern began to emerge.
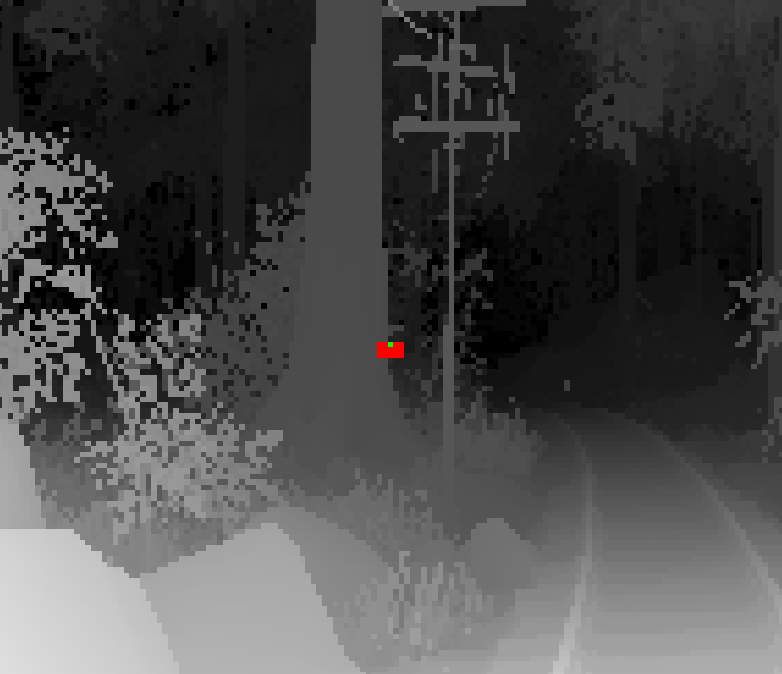
RenderDoc’s depth test overlay. An occlusion query dispatched for an extremely distant, large (about 5,000 x 700 x 400 units) object, showing a positive result (1 pixel is visible).
Since UE4 dispatches bounding boxes of meshes for occlusion queries, making it somewhat coarse and conservative (i.e. subject to false positives), we were having large meshes pass frustum culling tests, and then occlusion, by having just 1 or 2 pixels of the bounding box visible through thick foliage. Skipping through to the actual meshes in the base pass would reveal all of their pixels failing the depth test anyway.
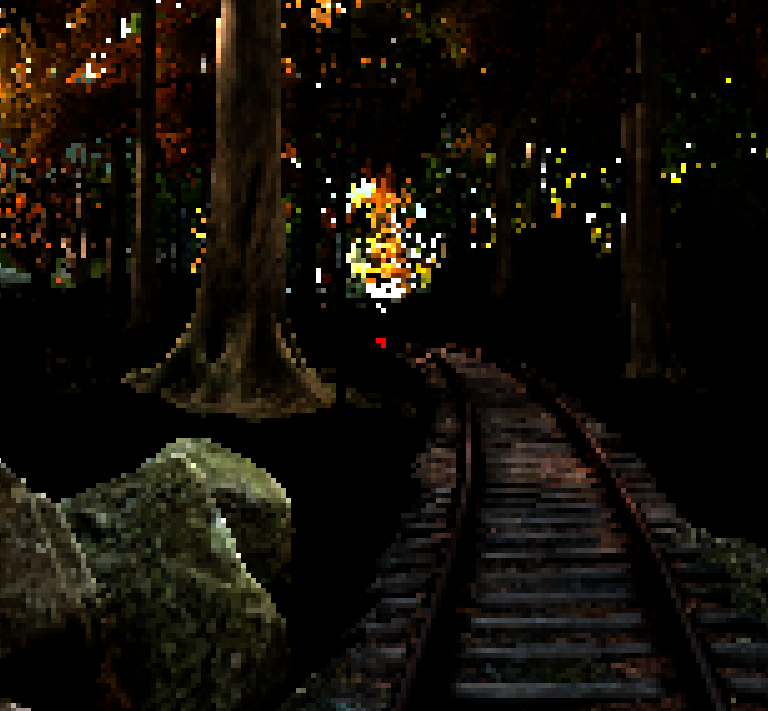
RenderDoc’s depth test overlay in UE4’s base pass. A mesh of decent size (~30k vertices, 50 x 50 x 30 bounding box), distant enough to occupy just 3 pixels (L-shaped formation in the centre). Successful in coarse occlusion testing, but failing the per-pixel depth tests.
Of course, every now and then, a single pixel would show through the foliage. But even then, I could not help noticing that it would be almost completely washed out by the thick fog that encompasses the forest at the beginning of the game!
This gave me the idea: why not add another plane to the culling frustum, at the distance where fog opacity approaches 100%?
Solving the fog equation for the distance and adding the far cull plane shaved another several hundred draw calls. We had the draw call counts back under control and in line with the rest of the game.
At some point late in development, AMD’s Matthäus G. Chajdas was having a look at a build of the game and remarked that we are using way too highly tessellated trees in the aforementioned opening scene. He was right: looking up the asset in the editor had revealed that screen sizes of LODs 1+ were set to ridiculous amounts in the single-digit percentage region. In other words, the lower LODs would practically never kick in.
When asked why, the artists responded that when using the same mesh asset for hand-planted and instanced foliage, they had the LODs kick in at different distances, and so they used a “compromise” value to compensate.
Needless to say, I absolutely hate it when artists try to clumsily work around such evident bugs instead of reporting them. I whipped up a test scene, confirmed the bug and started investigating, and it became apparent that instanced foliage does not take instance scaling into account when computing the LOD factors (moreover, it is not even really technically feasible without a major redecoration, since the LOD factor is calculated per foliage type per entire cluster). As a result, all instanced foliage was culled as if it had a scale of 1.0, which usually was not the case for us.
Fortunately, the scale does not vary much within clusters. Taking advantage of this property, I put together some code for averaging the scale over entire instance clusters, and used that in LOD factor calculations. Far from ideal, but as long as scale variance within the cluster is low, it will work. Problem solved.
But the most important optimization — the one which I believe put the entire endeavour in the realm of possibility — was the runtime toggling of G-buffers. I must again give Matthäus G. Chajdas credit for suggesting this one; seeing a GPU profile of the game prompted him to ask if we could maybe reduce our G-buffer pixel format to reduce bandwidth saturation. I slapped my forehead, hard. ‘Why, of course, we could actually get rid of all of them!’
At this point I must remind you again that Ethan Carter has almost all of its lighting baked and stowed away in lightmap textures. This is probably not true for most UE4 titles.
Unreal already has a console variable for that called r.GBuffer, only it requires a restart of the engine and a recompilation of base pass shaders for changes to take effect. I have extended the variable to be an enumeration, assigning the value of 2 to automatic runtime control.
This entailed a bunch of small changes all around the engine:
Moving light occlusion and gathering to before the base pass.
Having TBasePassPS conditionally define the NO_GBUFFER macro for shaders, instead of the global shader compilation environment.
Creating a new shader map key string.
Finally, adjusting the draw policies to pick the G-buffer/no G-buffer shader variant at runtime.
This change saved us a whopping 2–4 milliseconds per frame, depending on the scene!
It does not come free, though — short of some clever caching optimization, it doubles the count of base pass shader permutations, which means significantly longer shader compiling times (offline, thankfully) and some additional disk space consumption. Actual cost depends on your content, but it can easily climb to almost double of the original shader cache size, if your art team is overly generous with materials.
Except of course the G-buffers would keep turning back on all the time. And for reasons that were somewhat unclear to me at first.
A quick debugging session revealed that one could easily position themselves in such a way that a point light, hidden away in an indoor scene at the other end of the level, was finding its way into the view frustum. UE4’s pretty naive light culling (simple frustum test, plus a screen area fraction cap) was simply doing a bad job, and we had no way of even knowing which lights they were.
I quickly whipped up a dirty visualisation in the form of a new STAT command — STAT RELEVANTLIGHTS — that lists all the dynamic lights visible in the last frame, and having instructed the artists on its usage, I could leave it up to them to add manual culling (visibility toggling) via trigger volumes.
Now all that was left to optimize was game tick time, but I was confident that Adam Bienias, the lead programmer, would make it. I was free to clean my desk and leave for my new job!
In hindsight, all of these optimizations appear fairly obvious. I guess I was simply not experienced enough and not comfortable enough with the engine. This project had been a massive crash course in rendering performance on a tight schedule for me, and there are many corners I regret cutting and not fully understanding the issue at hand. The end result appears to be quite decent, however, and I allow myself to be pleased with that. ;)
It seems to me that renderer optimization for VR is quite akin to regular optimization: profile, make changes, rinse, repeat. Original VR content may be more free in their choice of rendering techniques, but we were constrained by the already developed look and style of the game, so the only safe option was to fine-tune what was already there.
I made some failed attempts at sharing object visibility information between eyes, but I am perfectly certain that it is possible. Again, I blame my ignorance and inexperience.
The problem of early-Z pass per-eye timings discrepancy/occlusion query stalling calls for better understanding. I wish I had more time to diagnose it, and the knowledge how to do it, since all the regular methods failed to pin-point it (or even detect it), and I had only started discovering xperf/ETW and GPUView.
Runtime toggling of G-buffers is an optimization that should have made it into the PS4 port already, but again — I had lacked the knowledge and experience to devise it. On the other hand, perhaps it is only for the better that we could not take this performance margin for granted.
Fun times!
Read more about:
Featured BlogsYou May Also Like