Trending
Opinion: How will Project 2025 impact game developers?
The Heritage Foundation's manifesto for the possible next administration could do great harm to many, including large portions of the game development community.
Featured Blog | This community-written post highlights the best of what the game industry has to offer. Read more like it on the Game Developer Blogs or learn how to Submit Your Own Blog Post
To provide a complete perspective on LTV, I’ve decided to outline what I’ve learned from my own experiences and those of experts from Rovio, Miniclip, Wooga, Space Ape Games, Pixonic and many others.

Three weeks ago I attended the PGC Helsinki conference where I've represented AppAgent in a panel discussion about “LTV for mobile apps” organised by Mika Levo from Pollen VC. The topic is incredibly complicated, and it proved impossible to discuss everything in just 20 minutes.
To provide a complete perspective on LTV, I’ve decided to produce this blog outlining what I’ve learned from my own experiences and those of experts from Rovio, Miniclip, Wooga, Space Ape Games, Pixonic and many others.
What I have found surprising is that all of the companies that I have spoken to have a slightly different approach to calculating LTV and profit. The goal of this post is to provide you with some ideas about how you should look at LTV, and what to take into an account when you do your own modeling.
The basic formula for LTV calculation is Lifetime * Average Revenue per Daily Active User. Lifetime is basically a number of active days calculated from retention. You do so by using a power function once you have few data points like D1, D3, D7, and D30.
 The devil is in the detail. Here are a few things you should keep in mind when calculating your LTV:
1) Every LTV calculation should be done specifically by platform, country, and channel (organic/paid or even FB/Adwords). A general number is absolutely useless.
2) You have to decide on your terminal point, which is basically how much in the future you are looking when calculating your LTV. Some companies go as short as 90 days, where some can go as long as 365 days. The decisions are up to you, but can depend on the game genre (casual games usually have a shorter lifecycle, except Candy Crush); and on your strategy (how long you are willing to wait for recouping).
3) Besides in-game revenue, you might also monetize with ads. But not every region generates the same eCPM (put simply, the revenue per-view). The basic approach is to calculate a single coefficient - a multiplicator of an in-app revenue. But, if you want to be precise, you should analyze the ratio between in-apps and ad revenue per platform and country. It’s common to receive 10-20% of revenue from ads which might change your profitability equation if you don’t break down this revenue stream into enough detail.
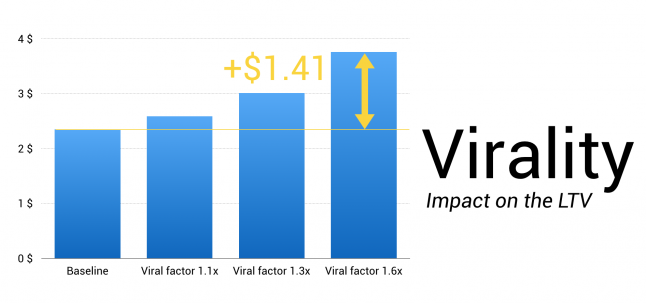
Virality is where companies differ the most. Surprisingly, even large publishers don’t always have systems in place to analyze the so-called “k-factor” (an industry term for virality). In fact, ignoring virality in your LTV formula might lead to you taking an over-cautious approach to UA, potentially limiting the scalability of your mobile business.
Here are four approaches that I have seen being used by developers:
Ignoring virality completely: the safest, but most conservative approach that can limit the scale of UA.
Considering everything else than paid traffic as “viral traffic”: the easiest, but least accurate approach as not all organic traffic is viral.
Including only the spillover of organic traffic from paid installs: an approach that’s still simple, but allows you to effectively attribute virality to acquisition.
Having multiple “k-factors” for in-game virality, featuring, charts impact etc.: the most complicated approach, requiring large data-sets collected over a long period of time. This approach leads to the most precise LTV estimates.
The preferred methodology depends on three things:
BI sophistication
Management tolerance to risk
Your company’s overall approach to UA
I personally prefer to take a more conservative approach, counting virality only from paid traffic (#3 in the list above). This can be done by analyzing the baseline of organics without running a paid acquisition. Once this has been done, look at the increase in the ratio of daily active users to new installs during the paid campaign. The difference can be attributed to the effect of paid installs, and can be used for multiplying your LTV.
Example: This game has a ratio between DAUs and new installs of 9% in the past 30 days, during which time no campaign has been running. You start a paid campaign in a selected territory and analyze the change in the ratio. For example, this could be 14% now, so your paid campaign has attracted 5% more viral users. Your K factor is 1.05 and you can now multiply your LTV by this coefficient.
I am inclined to use recursive virality, which involves counting users who were brought in by other viral users. To see how this works, imagine this as a pyramid where one user attracts another user who attracts another user and so on. It’s up to you how many “levels” you count in, but I suggest you stick to three as any more is usually just chasing numbers than a description of reality.
 The approach above is relatively basic, but is a good starting point for most companies. The more data you have, and the better the data scientists involved in LTV calculations, the more granular your viral factor should be. The most sophisticated companies like Miniclip leverage years of data which means that they are able to distinguish multiple types of virality. As a result, they have more precise models for very different scenarios and lifecycles of the game.
You’ve probably seen it yourself: someone is proudly claiming their LTV is $3.40 (or $4.70, $7.20 you name it…).
These numbers are useless for the simple reason that it can high for a casual game in Romania but low for a mid-core game in Australia.
Having a high LTV doesn't mean that:
The acquisition is profitable. If it's profitable then…
Is effective as CPI might be unnecessarily high and reduces profit margin.
The company's business is breaking even, or in profit as a whole.
What really matters is the profit that you are left with after you have included all costs including price per install, running costs of the company, dev costs of the product, taxes etc.
 For profit calculations, consider these points:
1) Discuss with your management team what your target ROI is. Companies that don’t include virality in their LTV estimates sometimes aim for 80% only, and count on the remaining 20%+ of revenue to come from organic. Some publishers simply aim for 100% ROI and consider organics as the source of profit covering development and other running costs of the studio. Then there are those companies which go for 140% ROI - including virality - to be really sure they are profitable after including all development and marketing costs.
2) The more granular ROI calculations (platform > country > ad network > campaign) the higher your profitability will be. It’s obvious that the automation of data analysis is the key for this. You can start simply by aggregating your data to a Google Spreadsheet from your attribution partner, and work with the data manually. Even by using such a simple setup, you will do more than 90% of other companies in the mobile space.
3) Define how you calculate revenue. Make decisions about whether this is gross, net, net after taxes… It’s good to be clear about this with your management team and CFO.
The final, but equally important aspect of working with LTV focuses on recoup. Basically, LTV is a value at the end of your terminal point, for example at day 180. Obviously, players spend their money throughout their lifecycle and you as a developer accumulate the revenue over time.
 The thing is that every game attracts users from different acquisition channels, and as a result have a different LTV recoup. This is important for two reasons:
To understand when you will get the money into your account. If you recoup 50% of the revenue in the first 15 days, Apple and Google will pay your share sooner than if your game monetizes after weeks of free gameplay. With rising UA budgets, cash flow becomes a critical factor which might slow down or even kill your traction.
UA managers can’t wait for 90, 180 or even 360 days to evaluate the profitability
of campaigns. Once you understand the LTV curve you’re able to see the monetization potential of the traffic much sooner. Companies such as Rovio need only 3-4 days to determine if they should continue a specific campaign or stop it. Revenue recoups, number of payers and then also several post-install metrics that serve as good predictors of the future revenue are essential KPIs for effective performance-based marketing on mobile.
 Your lifetime value calculation and everyday usage stats are critically important metrics, and are the foundation of a free-to-play business. The goal of this post is to shed some light on important aspects of LTV which aren’t often discussed at conferences. Perhaps it’s a result of its complexity, or that companies value their know-how a and don’t want to share it with others. I hope my research, testing and multiple interviews with some great minds of our business have inspired you to consider how best to calculate your LTV.
I would be glad if you would share your methodology and insights below. Or if you have any questions, please post those too.
If you’d like to receive more mobile marketing tips then subscribe to my blog or reach to AppAgent - mobile marketing experts for hire.
Read more about:
Featured BlogsYou May Also Like