Trending
Opinion: How will Project 2025 impact game developers?
The Heritage Foundation's manifesto for the possible next administration could do great harm to many, including large portions of the game development community.
Gamasutra analyst Matt Matthews takes a look inside June's somewhat unusual NPD U.S. console retail results -- strong hardware puts all eyes on the Big Three platform holders, but why can't software keep up?

[Gamasutra analyst Matt Matthews takes a look inside June's somewhat unusual NPD U.S. console retail results -- strong hardware puts all eyes on the Big Three platform holders, but why can't software keep up?]
Despite earlier hopes that the videogame industry would record a modest gain, the June 2010 U.S. console retail figures reported by the NPD Group last week showed that revenue was down 6 percent over last year. Unlike May, however, the hardware segment actually showed growth in June while the software segment declined by 15 percent.
In our examination of the details behind these figures, we'll take a long look at strong Xbox 360 sales as Microsoft launches its retooled S-model and discuss how software sales did not keep pace with hardware.
Next we'll turn our attention to first-party/third-party software sales on the Wii and demonstrate that Nintendo's hardware sales are quite strong now despite a temporary slowdown in the first quarter.
Before we begin, it's instructive to ground ourselves in the top line figures. As noted above, the overall industry saw fall in monthly revenue of nearly 6%, from $1.17 billion down to $1.10 billion.
Most of the year-over-year decline came from diminished software sales, which came in at $531 million including both console and handheld software, over $95 million below last June's figure. This was driven by a 14.7% decline in software unit sales and a 0.5% decline in the average price of software sold in June.
Strong sales of all three current-generation consoles (Nintendo Wii, Microsoft Xbox 360, and Sony PlayStation 3) pushed hardware revenue to a 5% increase year-over-year. Not only did the number of systems increase modestly, but those systems sold for a slightly higher price, up to $214 from $206 in June 2009.

Year-to-date the industry is down 9.4% in total revenue with the hardware segment being the greatest contributor to the loss. Software has fared better with average prices up by nearly 3%, year-to-date. However a 10% decline in units sold accounts for overall decline in total software revenue in 2010.
These figures refer only to retail sales estimates and therefore do not include other sources of revenue from subscriptions, downloadable console games (e.g. through Xbox Live or the PlayStation Network), or in-game content purchased through online services.
This other content and service may be purchased directly through debit or credit card transactions or through services like PayPal. Accurate data on these services is generally available to a limited number of parties, and therefore a comprehensive measurement of overall industry revenue remains elusive.
Microsoft's Xbox 360 system sales leapt ahead of the Wii in June, driven in part by uptake of the new Xbox 360 S (Slim) model introduced on 14 June 2010 at Microsoft's E3 press conference. The newer system was officially available for 15 days during the 35-day period during which the NPD Group measured what we refer to here as June sales.
Simultaneously Microsoft cut the price of older Xbox 360 hardware by $50, dropping the price of the top-end Elite model to $250 and the entry-level Arcade to $150. Some retailers stacked offers on these prices (e.g. a $50 gift card) which essentially dropped the system's bottom price to $100, equal to the PlayStation 2 MSRP.
According to Wedbush's Michael Pachter, most of the Xbox 360 systems sold during the month were actually these older, discounted models. As he wrote in his notes following the release of the NPD Group's data: “The slim version accounted for only 40% of Xbox 360 sales, with over 35% of sales captured by discounted Arcade bundles and the balance captured by discounted older models.”
Indeed, total sales of the system – across all models – was just over 451,000 systems during June.
The NPD Group's key game analyst, Anita Frazier, noted that June 2010 marked the system's second best non-holiday monthly total since September 2007 during the launch of Halo 3. In terms of a weekly rate, June 2010 (a 5-week month for the NPD Group) was actually slower than many other months, including February of this year and February 2009.
Given the figures above, it would appear that 180,000 Slims were sold during a 15-day period, a figure that deserves some consideration. Were that pace just for the Slim model to continue through July (a 28-day period for NPD Group purposes), we would expect Xbox 360 sales of about 340,000 units, the best July in the system's history.
However, the system need not maintain that pace to set a July record. Rather, if the system were to sell just 210,000 units, a mere 30,000 more than the number of Slims sold in June, then it would beat the figures for every July since the system launched in 2005.
Going forward, Microsoft is expected to release an updated low-end model at $200 to replace the discontinued Arcade model. Since we believe these models have historically made up a majority of Xbox 360 sales (see, for example, our analysis from February 2010), we expect that Microsoft will not know the full effect of the Slim redesign until consumers can again purchase this low-end model.
At this point we'd conservatively expect the Xbox 360 to hit sales of over 250,000 systems when the July estimates from the NPD Group are released next month. As the launch of the next Halo game approaches and a new $200 system is introduced, that rate could increase significantly.

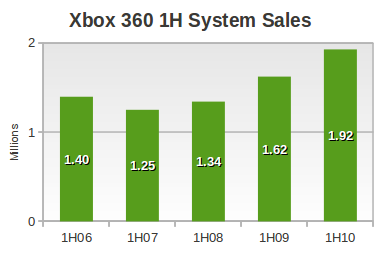
As shown in the figure above, Xbox 360 sales are already 18.5% ahead of last year's first half (1.92 million vs 1.62 million), and we believe the redesigned system is positioned well to appeal to consumers for at least the rest of the year. Just as the PS3 Slim led Sony to unprecedented sales, so might Microsoft expect to see another year of growth. For example, if the Xbox 360 demonstrates just 5% growth year-over-year in the back half of 2010, the system will break 5 million systems in annual sales. The actual figure for 2010 we expect to be as much as 5.5 million.
As usual, we think that strong hardware sales foretell stronger software sales in the near term, but June provided no evidence of that fact for Microsoft. In its press release about May 2010 sales the company reported software sales in excess of $156 million. Yet for June the company touted only $151 million in Xbox 360 software sales, a decline of about $5 million.
Since the NPD Group uses a 4-week period for May and a 5-week period for June, the decline last month was even more steep than the figures above would indicate. Taken as weekly averages, the company saw about $39 million per week in software sales in May and only $30.2 million per week in June, a drop of over 22%. The industry overall saw only a 9% decline in the average weekly software sales, month-over-month.
What to make of this shift? We would point to a comment made by NPD's Frazier, on the topic of sales of top 10 titles and the titles that fall beneath the chart: “[Industry software] sales are down, but the top 10 SKU's for the month sold comparably to what the top 10 did last June – game sales are more concentrated this year on the top-selling games.” The Xbox 360 had the top-selling game of the month (Red Dead Redemption) and four other titles in the top 20, but the decline we see in its software revenue figure in June may be an indication that sales of older titles (catalog sales) demonstrated weakness both in unit sales and perhaps also in pricing.
Fortunately for Microsoft, the year-to-date software revenue for the Xbox 360 is not as grim as the figures from the last couple of months. Given the revenue figures Microsoft has published in its press releases in several months along with comments made by analysts, we estimate that Xbox 360 software revenue is down only 3.9% so far this year, which compares rather favorably with the 8% decline for the industry overall.
When we analyzed software sales after the release of the May 2010 data, we noted that Nintendo's Wii had ceded some marketshare (measured in dollars, not units) while Sony's PlayStation 3 had gained share.
Subsequently we presented some figures, through calendar year 2009, demonstrating that Wii software sales – this time measured in units – were relatively flat in the past two years. On top of that, we noted that Wii software unit sales so far in 2010 were on track for a year-over-year decline.
This month, with the figures in for the first half of 2010, we thought we'd look once more at the market because there is one more angle we hadn't yet inspected: the division between first-party and third-party software Wii software sales.
As industry watchers well know, there has been an ongoing discussion about third-party software sales on the Wii. Nearly two years ago, Nintendo and Microsoft traded data points and graphs about third-party software sales on their respective console platforms.
Using Nintendo's own graphs presented to investors, we took our own whack at the first-party/third-party disparity and demonstrated that after approximately two years on the U.S. market approximately 3 third-party Wii titles had been sold for each 4 first-party titles.
At the beginning of this year, Wedbush's Pachter noted in a NeoGAF forum post that Nintendo's first-party software accounted for 47% of revenue and 38% of units on the Wii in calendar 2009. Compared to the LTD figures we computed at the end of 2008, the 2009 figures exhibited a ratio of 5 third-party titles for 3 first-party titles, a reversal in favor of third-parties.
That's a lot of disparate data, but we believe we can summarize it succinctly: Through the end of 2008, first-party software dominated Wii software sales in terms of units. In 2009 the roles reversed, with third-party software outselling first-party in terms of units. Revenue has generally been more evenly split between Nintendo and third-parties due to the higher average price of the company's own software.
To our question: How did third-parties do in the first-half of 2010 compared to the same period in 2009?
In a conversation with Wedbush's Pachter on this very point, we pieced together the following points:
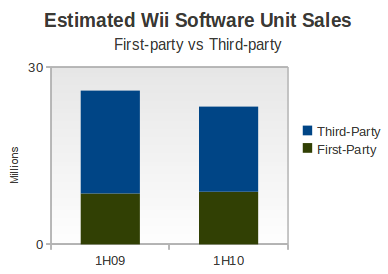
Third-party unit sales in 1H 2010 were down over 17% compared to sales in 1H 2009. Revenue fell by a more significant 25%
First-party unit sales were up only marginally, 2.9%, while first-party revenue dropped by approximately 14%.
In the first half of 2009 third-party Wii software was outselling first-party by a ratio of 2-to-1. During 2010, that ratio has drifted closer to 8-to-5 (or 1.6-to-1).
Given all the previous data made public about Wii software sales in both 2009 and 2010, along with our own estimates, we pieced together the following approximate view of Wii software sales in the first-half of the last two years.

When first asked about the Wii first-party/third-party software situation in 2010 relative to 2009, Mr. Pachter examined the data and commented to us that the data he saw “really tells a story” and that the “lack of Nintendo blockbusters [had] nothing to do” with the decline in Wii software this year.
Indeed, provided we have extrapolated correctly, third-parties are responsible for most of the decline in 2010: they are selling fewer units of software and that software is being sold at a lower average price. Some of this is apparently attributable to lower sales of music games (a genre which is a mere shadow of its former self), which have traditionally sold well on the Wii.
While Nintendo's own software is likewise selling for a lower price – due in part to lower sales of Wii Fit Plus packaged with the Wii Balance Board, it is still notable that it has increased its own unit sales in a year when software sales are down industry-wide.
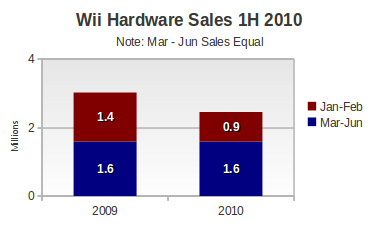
On the hardware side, Wii system sales appear to have been revived by the introduction of the new MotionPlus bundle which includes both Wii Sports and Wii Sports Resort. For example, as of the end of February 2010 the platform's YTD hardware sales were down an alarming 40%. However, Nintendo noted that it was dealing with supply issues at the time and in fact during the March – June period of this year hardware sales of the Wii are flat relative to last year.
The following figure makes it clear that Nintendo's real problems were in the first two months of this year while it returned to parity particularly during the second quarter.

To tie this back into software briefly, it seems possible that the decline in third-party software this year could be tied to the increased popularity of the new Wii bundle. When the bundle was announced, Pachter noted that the inclusion of Wii Sports and its successor, Wii Sports Resort, could cause the Wii software attach rate to “decline further from its already very low level”.
While it would take much better data than we have available to us, it is at least worth considering that new Wii consumers in the second quarter of 2010 have declined to purchase new software while they are entertained by the two titles packaged with their systems.
With a strong late of software in the back half of 2010, including some notable third-party titles, the Wii should be well positioned to maintain its robust hardware and software sales throughout the year. If indeed new Wii owners are holding off on software for the present, they will have abundant opportunity to purchase new titles as we approach the holiday period.
We took special notice of the comments about non-retail revenue made by the NPD Group's analyst, Anita Frazier, in the release sent to the press: “We'll also be reporting consumer reported sales of digitally distributed, rental and used games content to provide insight into those non-POS [non-point-of-sale] sources of game sales.”
This was made in the context of an annual retail revenue estimate for 2010, which Frazier suggested could come in around $20 billion. If reliable estimates were made available for the revenue generated outside of retail, the industry could certain point to a figure for higher total revenue amidst the reports of declining retail sales.
It has been known for some time that the NPD Group has been working to capture data about these other revenue sources, and they recently reported that an additional $4.5 - $4.75 billion was spent on videogame content outside of traditional retail.
That figure includes “used video games, rentals, subscriptions, digital full game downloads, downloadable content, and mobile game apps” but excludes revenue generated from social networking games.
Based on figures reported by GameStop (most recently analyzed here and here), we believe that at least $1.6 billion was spent on used games at that specialty chain and that in total the used game industry in the U.S. stood at around $1.8 - $2.0 billion for all of 2009. That leaves at least $2.5 - $2.75 billion generated by other content purchases and rentals.
That means that on top of retail software revenue of $9.92 billion in 2009 (excluding retail PC software sales), we would speculate that the industry can claim a minimum of $2 billion in content revenue, i.e. from those “subscriptions, digital full game downloads, downloadable content, and mobile game apps”. One can understand the attraction in being able to cite another 20% in industry revenue simply through better measurements of consumer spending.
The wording of Frazier's statement suggests that we may not receive these figures until next year, but having regular reported data would be a much welcome addition to our view of the industry, especially if the industry has good reason to believe that data is reliable. Given the NPD Group's close working relationships with the platform stakeholders (Nintendo, Microsoft, and Sony) as well as software companies and retailers, we will look to those parties for cues on the usefulness of any such NPD data.
The current industry position makes measuring the non-retail revenue particularly important. Just last week in his notes on the June 2010 data, Wedbush's Pachter suggested that Activision will address the “monetization of multiplayer” as a way to increase industry revenues outside of traditional retail sales. The methods he suggests – “a monthly subscription, tournament entry fees, microtransaction fees, or a combination of all three” – would not appear in the retail figures reported each month by the NPD Group.
This comes close on the heels of the $10 Online Pass being tested with EA Sports titles and a similar $5 code system required by THQ for owners of used copies of its UFC 2010: Undisputed brawler.
Not only will accurate measurements of these non-retail revenues be important to assessing the changing size of the industry, but it will also be important for determining how quickly the shift from packaged goods to online distribution is taking place.
Some analysts, like Pachter, have suggested that retail still has a decade during which it will dominate the videogame industry's revenue streams. We are somewhat less sanguine about the near-term prospects for retail, but are also have less access to industry executives who would presumably have access to better data than we have seen reported in public.
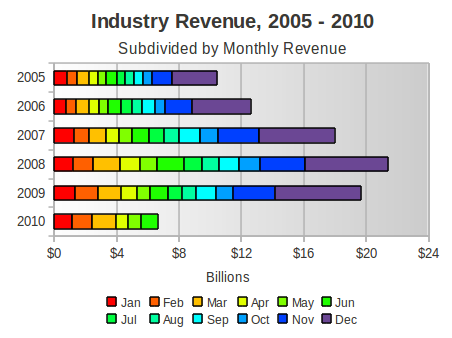
In closing, we'd like to return to that $20 billion figure cited by NPD's Frazier for total retail revenue in 2010. While that figure represents a mere 1.7% increase over the revenues for all of 2009, recall that the industry is $685 million behind where it stood in June of last year.
The figure below shows where the industry stands this year compared to the previous five years, subdivided into monthly revenue segments.

In fact, to reach precisely $20 billion at retail in 2010 the industry will have to manage over 8% growth for the back of the year. Our conservative nature leads us to believe that total industry revenue will be roughly flat in 2010, falling into the $19.5 billion range if not slightly lower.
[As always, many thanks to the NPD Group for its monthly release of the video game industry data, with a special thanks to David Riley for his assistance and Anita Frazier for her analysis. Additional credit is due to Michael Pachter, analyst for Wedbush Securities, for his perspective and instrucive conversations. Finally, many thanks to colleagues at Gamasutra and particularly regular commenters on NeoGAF for many helpful discussions.]
Read more about:
FeaturesYou May Also Like