Trending
Opinion: How will Project 2025 impact game developers?
The Heritage Foundation's manifesto for the possible next administration could do great harm to many, including large portions of the game development community.

Featured Blog | This community-written post highlights the best of what the game industry has to offer. Read more like it on the Game Developer Blogs or learn how to Submit Your Own Blog Post
This post is an the analysis of the game balance in Super Street Fighter IV. We analyze it using statistical methods and machine learning techniques, to see what can we learn in terms of the meta game, as well as to evaluate if the game is balanced.

This post is an the analysis of the game balance in Super Street Fighter IV. We start from the Shoryuken.com community tier list for the 2012 Arcade Edition of the game, a table that depicts the most probable outcome of a fight between two characters.
We analyze it using statistical methods and machine learning techniques, to see what can we learn in terms of the meta game, as well as to evaluate if the game is balanced. We find that, indeed, SSF4AEv2012 is a balanced game.
Then, we study if it is possible to predict the outcome of match between two characters having information about them, like the frame data of their movements as well as qualitative characteristics like "Ryu is able to launch projectiles" to "Rufus has a dive kick". Being able to predict match outcomes from character data is a powerful idea not explored yet in fighting games. On one hand, it would allow players to build automatic tier lists that would help them to choose character wisely in terms of the meta-game. On the other hand, it would allow game developers to quantify the balance of their games without having to resort to expensive and low-coverage location tests, which, although necessary, are not enough to balance a game for competition.
Our results indicate that match outcome can be predicted, but we have insufficient data for it to be good enough, although the potential is there. The needed data already exists - it is available thanks to online gaming.
Having said that, let's start.
This is what a tier list looks like:
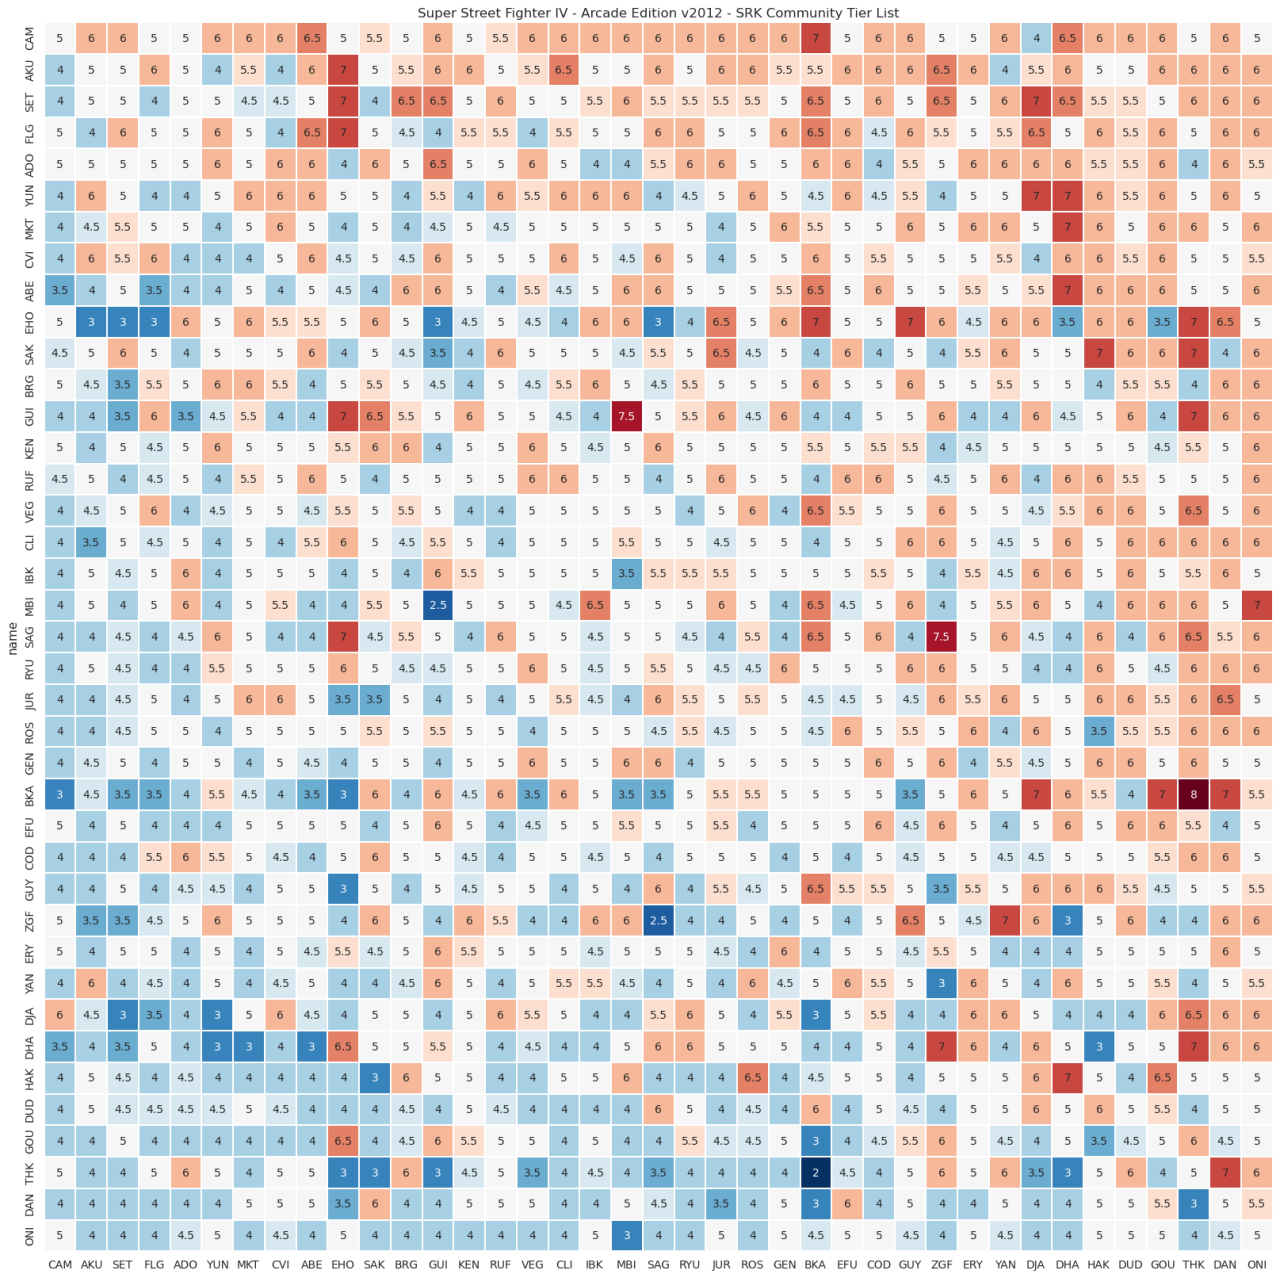
It's a matrix where each element depicts the most probable outcome of a match between two characters. For instance, in the second row (character: AKUMA) and four column (character: FEI LONG), the number 6 indicates that Akuma has advantage over Fei, expressed as: "from 10 matches between players with equal skills, 6 of them will be won by Akuma". Such claim is merely theoretical - it's impossible for two players to have the exact same skills.
This tier list has been built from the experience of skilled players who have gathered to discuss and come to an agreement in terms of how characters relate to each other. You can have a very good approximation of what are the chances of your character in competitive settings by looking at the table an analyzing your odds against other characters.
Usually, tier lists are displayed as a flat table. In the image above, we added a divergent color scale, where a 5/neutral matchup is displayed as white, a negative matchup is displayed with shades of blue, and a positive matchup is displayed with shades of red. You can see how red dominates the upper-right part of the matrix. This is because the matrix is ordered in a way that places characters with positive matchups ("top tiers") at the top, and characters with mostly bad matchups ("low tiers") at the bottom.
Usually, tier lists contain two extra columns: the rank of each character (for instance, A+) and the sum of all matchup points per each character. We won't focus on the tier rank, but we will analyze the sum of matchup points. We call this value tier points.
The following chart displays tier points for all characters in the game. You can see that the curve is monotonically decreasing, as characters are sorted from top to bottom. We have annotated the chart with some quantile lines, to depict how the tier points are distributed. Those above the 90% quantile of tier points are the top tiers of the game. We actually don't know what is the criteria to define if a character is S+, A+ or A in the community tier list, but an approach on quantiles could be good to do that classification. For instance, we could say that characters above the 90% quantile are S+, characters between 80% and 90% quantile are A+, characters between 60% and 80% quantile are A, and so on.
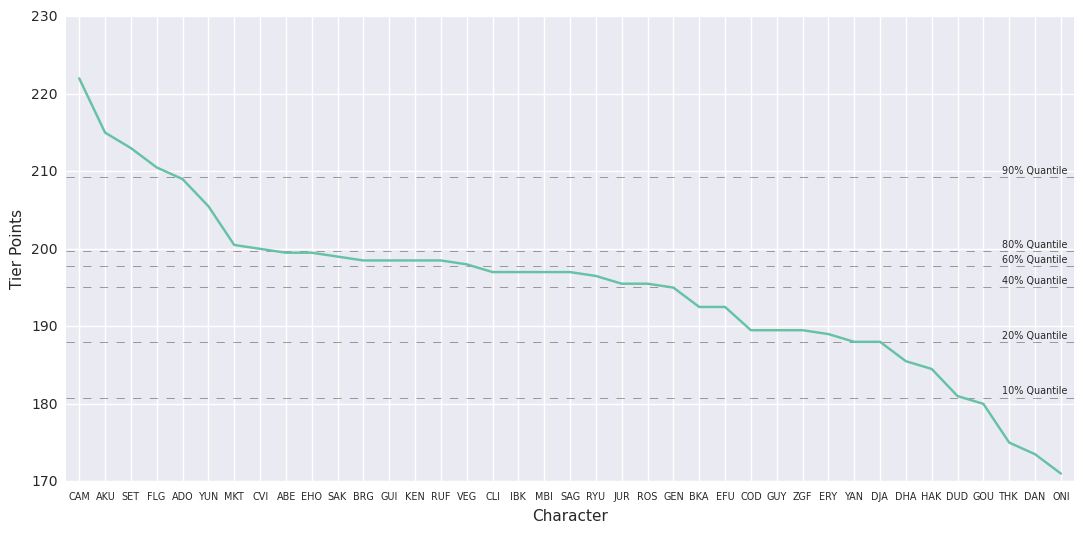
This curve doesn't tell us if the game is balanced. We see, however, that the curve flattens below the 80% quantile, and that it starts to decrease again below the 40% quantile. This shape is interesting - it tells us that characters above the 40% quantile and below the 80% quantile are very similar in terms of tier points. Is this balance?
To start analyzing this, we identify what game balance is in the context of Street Fighter. As we mentioned, the relationship between two characters is known as matchup, which can be characterized as positive (its value is greater than 5), neutral (its value is 5) or negative (its value is less than 5). Some people could say that a balanced fighting game has only neutral matchups. Designing a game like with many characters with different abilities seems to be impossible, and, if possible, it would be so hard to do that it might not worth the effort. Not to mention that it would have a flat meta-game - it would be boring.
As a first approximation to game balance, we propose that a balanced fighting game shows a gaussian distribution of tier points. To test if SSF4AE2012 is balanced, we plot its tier points distribution, jointly with a kernel density estimation and a gaussian distribution with the same mean and standard deviation of tier points in the game:
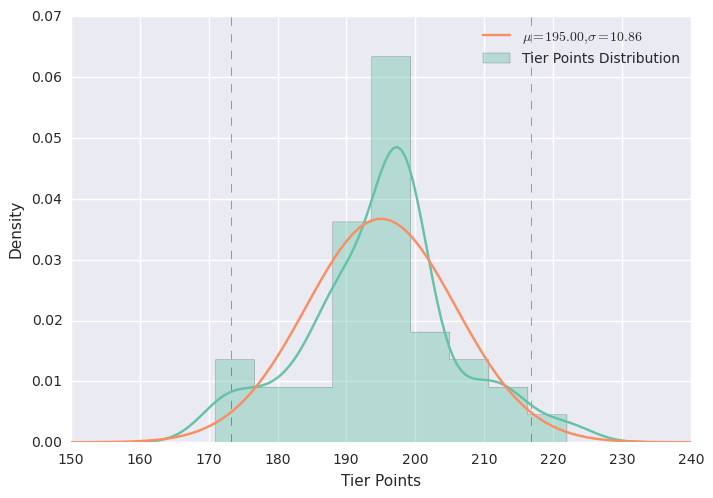
The kernel density estimation shows a gaussian-like distribution. We can confirm this by performing the Shapiro-Wilk test, which, given our tier points, tells us if such sample comes from a normal distribution. We find that, indeed, there is a 25% chance that the tier points are distributed normally (we also performed a QQ-plot test to confirm the result) - in scientific experiments, the threshold to accept this hypothesis is 5%. However, is this sufficient for the game to be considered balanced? Or is it just a necessary condition?
Let's analyze the metagame to find out.
The existence of a tier list built by expert players where almost every character has at least one positive matchup it's a good indicator of balance. But a tier list doesn't indicate by itself how characters relate to each other in terms of their ranking. This is why the gaussian distribution of tier points is not enough to claim balance.
We propose to cluster characters based on their performance against other characters. One way to do this is to perform Agglomerative Clustering on the tier list. This kind of clustering groups characters according to how near they are, computing the distance between two characters as the euclidean distance between their matchups. Then, groups are formed with characters that are close between them and that have a low variance in terms of matchups as a whole. These groups are built bottom-up, meaning that we start with small groups that are merged with others until we have one big group. You can see this clustering in the following image (note that characters are sorted according to the resulting clusters):
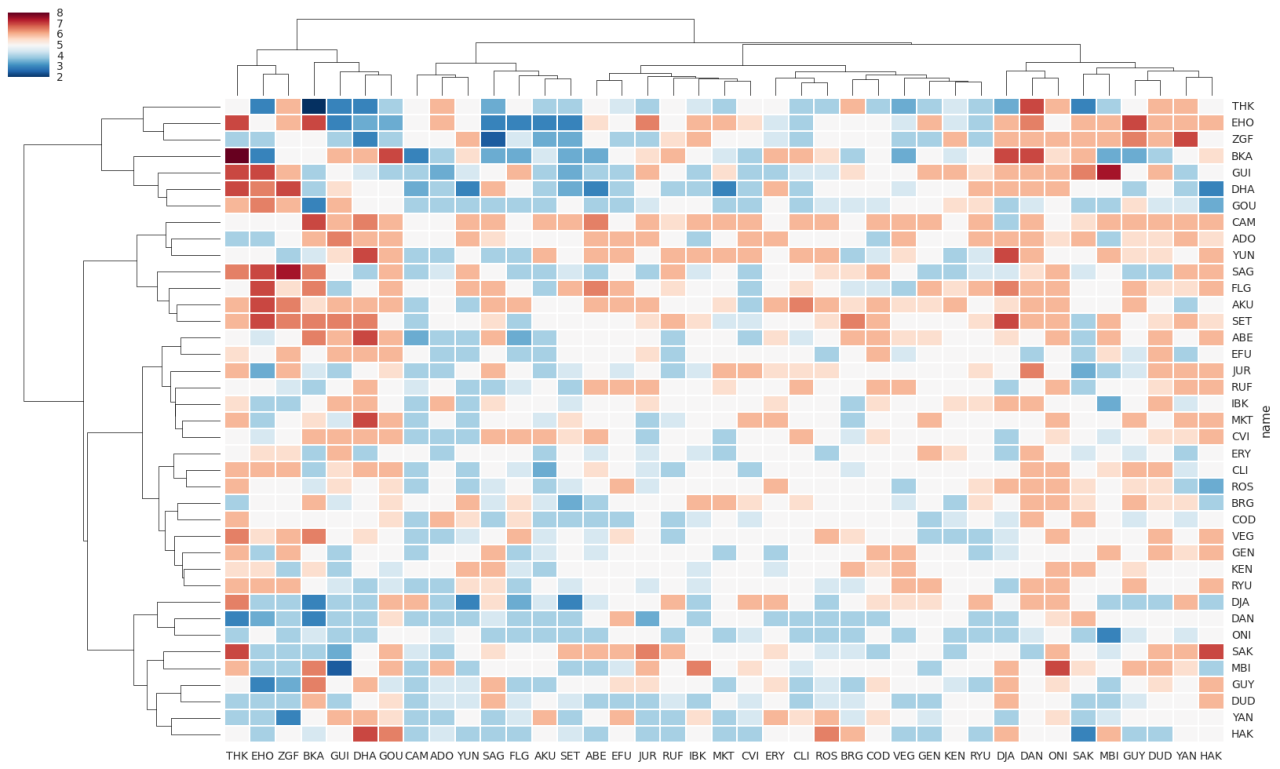
We did not display matchup numbers to avoid cluttering the chart. Although the number of clusters is high, depending on which level of clustering you want to analyze, we think that four clusters are clearly visible:
THK, EHO, ZGF, BKA, GUI, DHA, GOU (Average points: 188.64)
CAM, ADO, YUN, SAG, FLG, AKU, SET (Average points: 210.29)
ABE, EFU, JUR, RUF, IBK, MKT, CVI, ERY, CLI, ROS, BRG, COD, VEG, GEN, KEN, RYU (Average points: 196.31)
DJA, DAN, ONI, SAK, MBI, GUY, DUD, YAN, HAK (Average points: 185.72)
If we sort the clusters by tier points and display a segmented tier list, this is what we have:
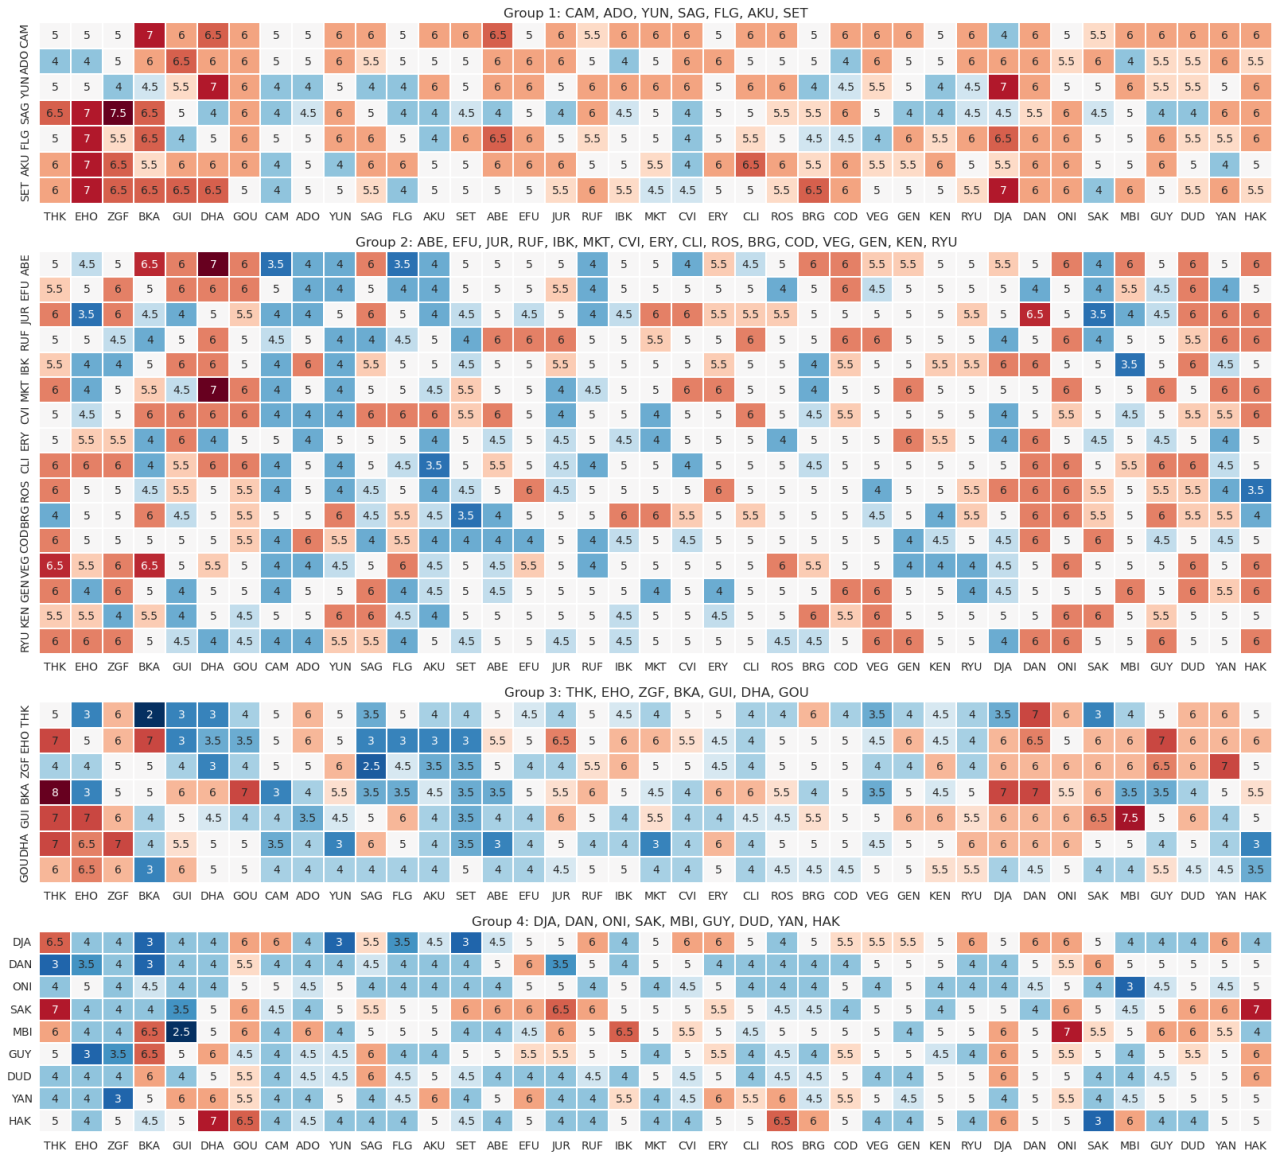
Cluster 1 (top tiers) show a clear dominance over the entire cast. Clusters 2 and 3 (mid tiers) show many positive matchups against the entire cast, but cluster 2 has many neutral matchups (white cells with 5) while cluster 3 has much more negative matchups (blue cells). Also, cluster 2 shows a clear dominance over clusters 3 and 4, while cluster 3 only has a dominance over cluster 4. Interestingly, a subset of characters in cluster 3 dominate the other (note the lower-left corner of cluster 3's tier list).
It is interesting to see that even characters from cluster 4 have some positive matchups against characters from all groups. It's just that those matchups are not common on the entire cluster.
To depict how tier points are distributed by cluster, we use violin plots, which basically perform kernel density estimations on each cluster and displays those estimations side by side:
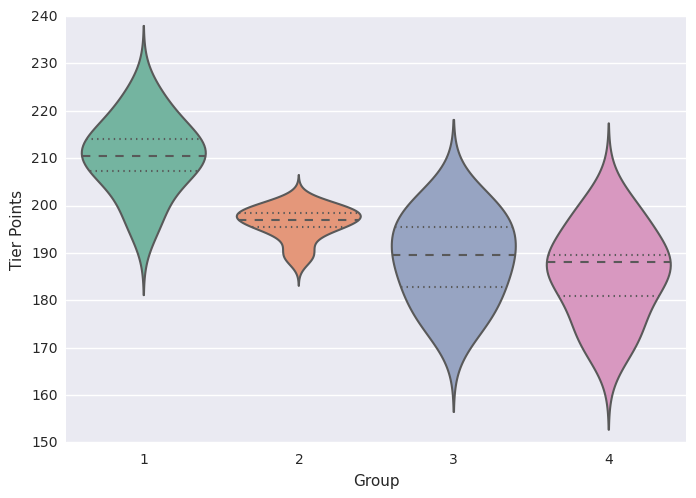
Although we ordered clusters manually according to their average tier points, character ordering inside clusters was determined by the algorithm. To validate the order of characters, we performed a Kendall's Tau test. This test compares two different orders of items and returns a number between -1 and 1. If both sets have the same order, the result is 1. If both sets have an opposite order, it returns -1. If both orders are independent, it returns 0. The order of characters indicated by clustering and the order based on tier points has a score of 0.51, which means that the clustering makes sense from a ranking point of view as both orders are very related.
Now that we have a quantification of the meta-game based on characters, we can perform balance analysis based on it. We do so by defining a matchup graph.
We built a graph from the tier list, where each character is a node, and two characters are connected if one has a positive matchup over the other. For instance, Cammy has a positive matchup against Ryu, and thus the node CAM is connected to RYU. We call this graph the Matchup Graph. Note that neutral matchups are not included.
By using graphs it is possible to perform many different kinds of analysis by focusing on their connectivity. For instance, social networks recommend people to connect with by analyzing user connections. In this aspect, we estimate a subset of the Matchup Graph called Dominating Set. To quote Wikipedia: "every vertex not in D is adjacent to at least one member of D". In our graph, this translates to: if you pick all characters in the dominating set of the matchup graph, you will always have a character who wins. The dominating set of the matchup graph is able to defeat the entire cast!
The Super Street Fighter IV dominating set is displayed in the following image (dominating characters are purple, and edges are thicker in the node with matchup disadvantage):
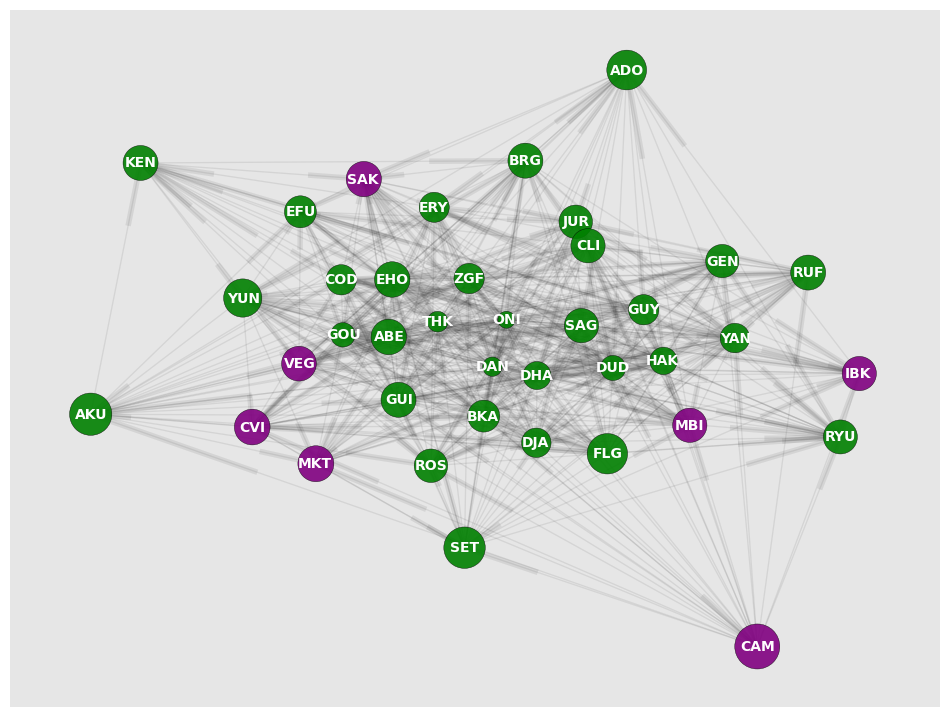
Characters in the dominating set include Cammy, a expected result given her position on the tier list. But there are surprises, like Sakura (SAK) and Dictator (MBI) from cluster 4. All other characters are from cluster 2. This means that from from four clusters, three of them are represented in the dominating set. We believe this is a strong indicator of balance - although not perfect balance, as cluster 3 is not represented.
We can quantify this diversity in the dominating set by estimating its Shannon Diversity Index. This index, which is also known as Information Entropy, indicates the unpredictability of the set. For instance, if all characters in the dominating set were from the same cluster, it is trivial to predict to which cluster a random character from the set belongs. At the same time, if all clusters were equally represented in the dominating set, if would be harder to predict to which cluster a random character from the belongs, as all clusters have the same probability. The formula to estimate entropy is the following (image from Wikipedia):

In our context, p_i is the probability of cluster i to be present in the dominating set. Since we have seven characters in the dominating set, the cluster probabilities are 1/7, 4/7, 0 and 1/7. We exclude the cluster without characters from the calculation, as logarithms are not defined for 0. The result is the number 0.88. The upper bound of entropy is the natural logarithm of 4 (because we have four clusters), which is 1.39 (both numbers were approximated to two decimals). Then, to obtain a number between 0 (no entropy) to 1 (maximum entropy), we can divide the obtained entropy with the estimated upper bound. The result is 0.63. Is this number representative of a balanced meta-game? We believe so.
Therefore, SSF4AE in its 2012 editio, is a balanced game, as its tier points are distributed normally and its meta-game is diverse.
Building a reliable tier list takes lots of time. It probably takes years. And every iteration of the game (remember that now we are in Ultra Street Fighter IV) changes the tier list by modifying the properties of character movements as well as the addition (or removal) of new (old) characters.
In this part of this post, we propose that tier list could be predicted by using machine learning techniques. To do so, we will use the Frame Data of the game, plus several Character Variables.
The Frame Data characterizes every move for every character in the following way: how much time (in frames) the movement takes to start, how much time the movement is active (i.e., it can hit or grab the opponent), how much time the movement takes to recover after hitting/missing/being blocked. This includes the damage associated to each movement.
The Character Variables indicate how fast each character moves on the screen, how much time they spend on the air when jumping, how much time they need to perform a forward/backward dash, the throw range, and some qualitative variables like "has projectiles" (i.e., they have hadoukens), "has changeable jump arc" (i.e., they have a divekick or similar movement), and so on.
We normalize both inputs in a way that allows us to compare two characters. For instance, if we represent all character data for Ryu as a vector v, and all character data for Rose as a vector w, we can compute the difference v - w. Each element of this resulting vector indicates, for instance, whether Ryu has more damage output or if Rose moves faster.
Having those differences, as well as the tier list, makes possible to build a predictive model that, given the difference between two characters, predicts who will win (or lose, or have a 5 matchup). In particular, we consider Extremely Randomized Trees. We built a model using character differences and the corresponding matchup value. For instance, we estimate the difference between Rose and Ryu as indicated above, and, since the matchup value is 5.5, we indicate to the model that the outcome is WIN. If we would have estimated the difference between Ryu and Rose, the value would have been 4.5, and the model would have received LOSE as input. In the case of 5 point matchups, the outcome was specified as TIE. For all pairwise combinations of characters we estimated the differences and the outcomes given by the tier list, and feeded those to our model.
Does it work? We performed a two-fold cross validation on our model, and obtained an average accuracy of 41%. Although it seems a low accuracy, this is better than random guessing with 33% accuracy. The following image depicts the confusion matrix of our analysis:
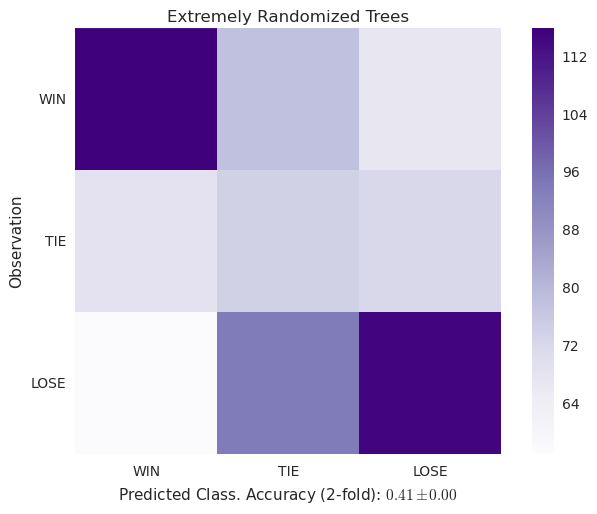
What the image indicates is that our model is good at predicting wins and loses, but not ties. We believe the low accuracy is a consequence of the small dataset we have - in machine learning, you often need thousands of samples to have a meaningful model. We only have 741 pairwise comparisons of characters. Still, we were able to outperform random guessing, and that is good.
The usage of predictive models allow us to estimate the answer, as they estimate the predictive power of each character feature. The next chart displays the top-50 features:
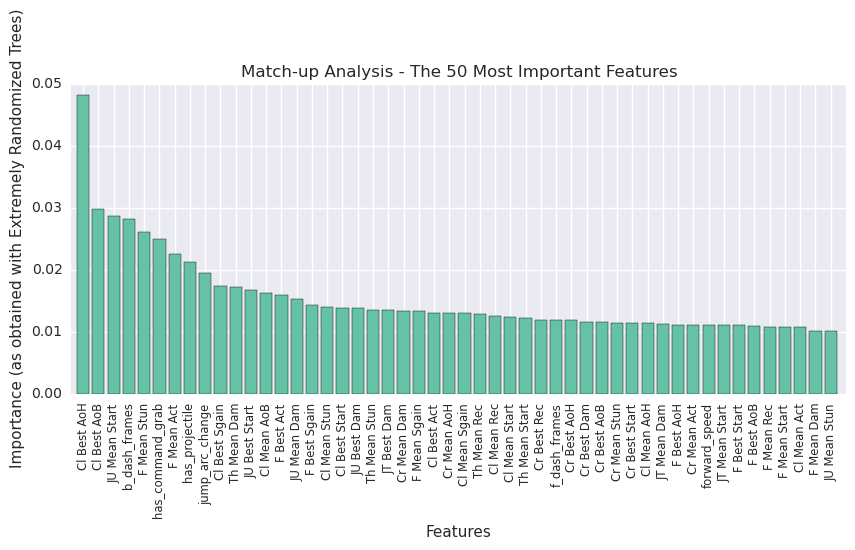
The top-5 are: Close Best Advantage on Hit, Close Best Advantage on Block, Jump Up mean start, backdash frames, and Far Mean Stun. This means that characters whose offensive allows them to link movements in combos and keep the pressure thanks to their advantage on block are more likely to be top tiers. Probably the Jump Up mean start variable is just noise, as the model is not perfect, although having a good backdash is important (I know that being a Rose player :) ).
Now, Imagine what could be done with more data. We know this data exists, as it is gathered and saved by CAPCOM every time a ranked online match is played!
In this post we performed a brief analysis of the balance of Super Street Fighter IV Arcade Edition v2012. We observed that the game is balanced, that is has a complex meta-game, and that there is the possibility of predicting matchups given the frame data and character variables. We just need more comparisons between characters (i.e., match results) to be able to build a stronger model.
What are the implications of this? For players, these methods help to analyze and extend the knowledge of the meta-game. Players could feed this information into game-theory applications and perform strategic character picking. In addition, players could build local meta-game knowledge - tier lists are not equal at different locations. This would allow us to understand how Street Fighter is played in different cultures.
But the biggest potential relies, in our opinion, in game balancing. We, as players, do not want a perfectly balanced game. We do not need it. We need carefully thought game mechanics and a deep meta-game that estimulates competition, yet we do not know how game designers approach those complex tasks. We believe automated tools that quantify balance and changes in character definition will help to produce better, more engaging and competitive games in the future. Our approach would help to quantify how far away the current design is from an expected tier list, as well as which character changes will help to advance in that direction. The tools and ideas are there, as we have shown. The data is there too. We just need to be able play with it.
To conclude, we know that our model has limitations. There is much more character data that could be considered. For instance, hit boxes would allow to add movement ranges into the model (consider Dhalsim, who is very slow but with extreme attack range). And not all fighting games are equal - we wonder if such a model is extensible to other franchises like Guilty Gear or The King of Fighters. However, we do believe that this approach will help to inform game design and balance decisions in fighting games. Our purpose is not to replace the balance process, on the contrary, we want to make it stronger.
We have used the tierlist of an already obsolete game - the current edition of Street Fighter IV is the Ultra edition of the game, with balance changes released on December 15th. We wonder if those changes are based on actual gameplay data. We hope so!
This post is joint work by Eduardo Graells and Alonso Astroza from Ryuuko.cl. We are also grateful to Sergio Salgado and the /r/dataisbeautiful reddit community.
Read more about:
Featured BlogsYou May Also Like