Trending
Opinion: How will Project 2025 impact game developers?
The Heritage Foundation's manifesto for the possible next administration could do great harm to many, including large portions of the game development community.

Featured Blog | This community-written post highlights the best of what the game industry has to offer. Read more like it on the Game Developer Blogs or learn how to Submit Your Own Blog Post
A revolutionary way of visualizing and understanding your data.

I was always puzzled by the practical applications of traditional game analytics. I consider myself an action-oriented person. When a new batch of data is collected and analyzed the result should be a fixed set of action steps, right?
Are my players engaged with the latest prototype? Where should I focus my attention? What are the bottlenecks? These are the "ultimate" questions I am usually asking myself.
Unfortunately, the traditional game analytics tools are not that great at answering such open-ended questions.
So far, the best trick in the hat of every game designer is a cohort-based funnel model. A simple approach that allows to weed out the obvious, most glaring issues.
.png/?width=700&auto=webp&quality=80&disable=upscale)
A traditional funnel model. Simple and not very effective.
But players are all so different! And they play a game in so many different ways.
Using the traditional approach it is very hard or even impossible to catch specific problems that are bugging only some of the players or only under certain conditions. Somehow, most of my issues are exactly of that kind.
Can I get more value out of my data? Ideally, some actionable insights.
Fortunately, by virtue of working closely with AI tech for several years, I dived into real-world Machine Learning. To my pleasant surprise, it already has advanced enough to be a great help in this tricky area.
Yes, there is a way to understand your players and your data much better.
The main power of Machine Learning classification is the ability to extract valuable patterns from data. Imagine if you could classify all your players by the way they play a game (playstyle) and then seamlessly analyze the gameplay of these playstyles based on any metric.
We are building a data framework that can do just that. Below are the latest field test results:

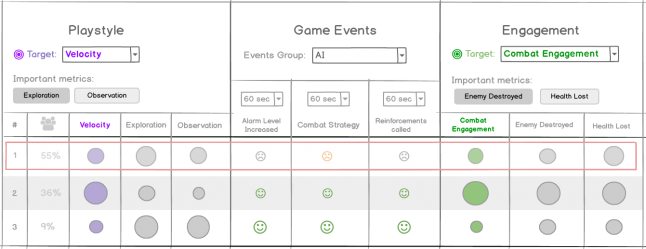
A.I.-powered analytics in action. Each row represents a separate playstyle.
To understand the metrics better it's worth mentioning that our game is a first-person stealth action. You need to find your way to a safe on a level protected by robotic security, crack the safe and get out alive. The described approach, however, is not limited to certain games or genres.
Creating new playstyles is as easy as choosing a "target" metric I am interested in. Let’s take the first example in the image below. Exploration - is a measure of the level area that players have visited. Once I choose the target, the next steps are happening automatically:
The A.I. finds "Important metrics" that are related to the target one. In our case, it’s Avoiding Detection and Velocity.
Playstyles are built based on the target and important metrics. Each player is assigned to a single playstyle.
Rows appear in the UI corresponding to each generated playstyle.
Game Events and Engagement sections are calculated based on the actual players’ behavior.

Examples of the Playstyles section for different target metrics.
To analyze what is driving my players I am choosing the Engagement target. Again the “A.I. magic” is supporting my choice:
Important engagement metrics are automatically extracted from the data based on the target one.
All relevant metrics are added to the table so I can get a deeper understanding and more insights into my players’ engagement.
The Game Events section is immediately (re)calculated based on my new choice.

Examples of the Engagement section for different target metrics.
This section is where the A.I.-powered approach really shines. We get the answers to our ultimate questions: How different playstyles are engaging with my game?
As I already have shown, playstyle and engagement variables in this question are easy to define and redefine at any moment.
And the answers are usually quite evident:

The mood, size, and color of a smiley face demonstrate the measure of engagement related to a certain game event.
So, what actionable insights can I find here?
Obviously, the first row represents the "run-and-gun" Playstyle. Players who do not care much about being detected. Our Engagement metric is Avoiding Detection so having an orange sad smiley in this row for the Reinforcements called event is quite ok.
However, players from the next row are obviously trying hard to avoid detection. The smaller smiley size for the Reinforcements called event indicates that I should probably keep an eye on the size and behavior of the reinforcements after all. Perhaps AB-test it before the next public release?
Or perhaps something better? What if we could use this approach to drive game design decisions?
In my example, what if we could vary the size of the reinforcements for each player depending on the detected Playstyle? Send more for the "run-and-gun" players and less for the sneaky types?
Yes, I want to be able to give my players different kinds of challenges depending on how they play my game. Well, this idea is why we started building the framework in the first place…
But that’s another story! It deserves a separate article, so stay tuned for more.
Read more about:
Featured BlogsYou May Also Like