Trending
Opinion: How will Project 2025 impact game developers?
The Heritage Foundation's manifesto for the possible next administration could do great harm to many, including large portions of the game development community.
Today's games have to manipulate growing amounts of data, but most of this data is out of the cache when it's needed. Fetching data in advance using the Streaming SIMD Extensions gives games better control over the cache. See how it's done, using a sample application as an example.
July 30, 1999

Author: by Ornit Gross
The most appealing applications today for the home PC market handle growing amounts of data. Video decoders and encoders manipulate big frame buffers, 3D games handle large textures and data structures, and speech recognition applications demand a lot of memory. Unfortunately, most of the data that these applications need is out of the cache when it's most needed.
Transferring data to and from the main memory slows down the application, forcing it to wait for the data to become available. However, in some cases, the data address is known ahead of time and the data could have been fetched in advance, reducing these waiting cycles. Until now, those who have tried to prefetch the data by simply reading it in advance discovered that this trick does not work well.
With the advent of the Streaming SIMD Extensions for the Pentium III processor, game developers now can use instructions for controlling the cache, which use prefetches and streaming stores. However, these instructions must be used carefully, because excessive use may not lead to the expected speed boost, and may even slow down your game.
About the New Prefetch Instructions
The new prefetch instructions of the Pentium III provide hints to the processor – they suggest where into in the memory hierarchy the data should be prefetched. However, there's no guarantee that the data will be fetched. The prefetches do not affect the functionality of your code, apart from moving data blocks along the memory hierarchy.
There are dedicated prefetches for data of temporal locality (data that will be accessed again in the short term) and for data of non-temporal locality (data that is accessed only once). The four prefetch instructions are as follows:
PrefetchNTA. This instruction is for non-temporal data. It only fetches into the first level cache (L1), without polluting the second level cache (L2).
PrefetchT0. This instruction is used for temporal data that fits into L1. It fetches into the whole cache hierarchy of L1 and L2.
PrefetchT1. This instruction is for temporal data that fits into L2 without polluting L1.
PrefetchT2. This implementation in the Pentium III processor is the same as for PrefetchT1.
(The Intel Architecture Software Developer's Manual provides a complete architectural description of the prefetch instructions, beyond their implementation in the Pentium III processor.)
Unaligned accesses are supported, and the prefetch does not split cache lines. In other words, only one cache line of 32 bytes is fetched, which includes the address of the prefetch. If the data is already in the desired cache level, or closer to the processor, then it is not moved.
You cannot prefetch data from uncacheable ranges such as Write Combining, AGP, video frame buffer, and so on. These prefetches are treated as no operations (NOPs).
An attempt to prefetch an illegal address is ignored, meaning there is no data movement. You do not get an exception. It is difficult to track pointer bugs in the prefetch address (wrong address to prefetch from), which do not result in improved performance.
Using Prefetches Efficiently
Using prefetches efficiently is more of an art than a science, but any developer can acquire the necessary skills. To take full advantage of the prefetches, you must follow several simple guidelines. Following these guidelines can make the difference between great and acceptable prefetch optimizations. The micro-architectural reasons for such guidelines are based on the organization of the load buffer, the store buffer and the fill buffer as described in the Intel Architecture Software Optimization Reference Manual. The guidelines derived from the micro-architecture are:
Prefetch only when the probability of a cache miss is high (use the VTune analyzer as described in the section below titled, "Analyzing a Sample Application"). Redundant prefetches may carry some overhead, so be thrifty about using prefetch instructions.
Avoid prefetching the same cache line (32 bytes) more than once. Instead, unroll your loops to handle full cache lines per iteration, making it easier to arrange the prefetching per iteration.
Change your data structures to include as much useful data as possible. Use the structure of arrays (SoA) format instead of the array of structures (AoS) format to increase the prefetching efficiency. The data is already available, so make use of it now instead of prefetching it again later.
Spread the prefetches among other computational instructions, and if possible, space them out, and don't use them around load instructions. This guideline is tightly related to the following one, and is based on the processor resources that both the prefetches and the loads share.
Carefully mix prefetches, streaming stores, loads and stores that miss the caches, and stores to uncacheable memory range. All these instructions cause data transaction to or from the main memory, and all of them share the same valuable processor resource
Analyzing a Sample Application
Let's analyze an application, using VTune, to get feedback about performance and observe the benefits of prefetching. The application we'll analyze uses the motion compensation (MC) kernel. The motion compensation kernel is well known to developers who work with MPEG video. It is a very memory-intensive part of both the MPEG decode and encode algorithms. MC creates the next frame in a video sequence by reconstructing one or two previous frames.
This example shows one mode of video frame construction. It generates a 16x16 pixel macroblock by reconstructing two 17x17 pixel blocks from two different reference frames, following these two steps:
Thoroughly average a half-pixel down and half-pixel right for both references.
Average the result.
The motion vectors that point to the source block (or blocks) are not necessarily aligned on any boundaries. The data is not usually in L1, and sometimes not even in L2.
The code used for this example produces fully accurate results according to the MPEG standard. Such high accuracy is not necessary, and some developers will use the less accurate version, which is also acceptable. The example can also be further optimized by, for example, solving the data cache unit (DCU) line split for better prefetching efficiency.
This example shows how VTune analyzer can be used to examine prefetch optimizations. The performance results shown here are taken from a test application and not from a real MPEG application.
As in all optimizations, begin by understanding the performance problems of the application. Run the VTune sampler and collect clockticks samples to identify the functions or modules with heavy processor consumption.
Figure 1 shows that most of the cycles (92.65%) in this example are spent in the MC routine. This routine requires optimization. When you run the VTune analyzer on your application, you will get a different view of all the functions. Start optimizing the taller (heavier) ones.
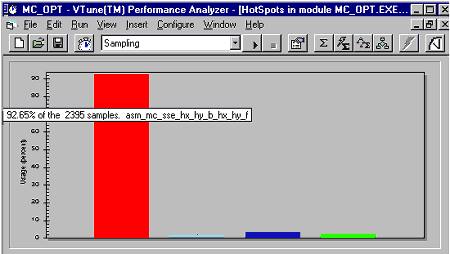
Figure 1. Clockticks Hotspots by Function, Before Prefetch.
A closer look at the clockticks distribution per location in the code shows two major, very localized peaks that together consume almost 60% of this function's cycles. These are shown in Figure 2. (Note that some of these figures are only partial snapshots of the VTune analyzer windows, due to space limitations. Since the layout is the same as above, only the section of the screen displaying a change is shown.)
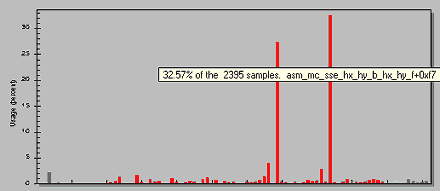
Figure 2 – Clockticks Hotspots by Location, Before Prefetch.
Look at the L1 cache event distribution in Figure 3 to see a peak of L1 misses surrounding the suspicious code area.
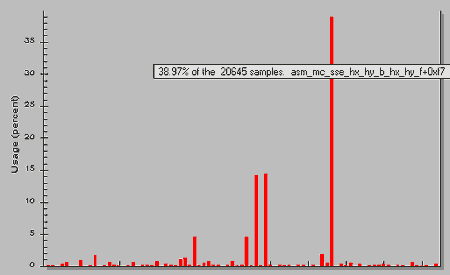
Figure 3. L1 Lines Allocated Hotspots by Location.
Moreover, the L2 cache misses shown in Figure 4 are almost identical to the clockticks distribution in Figure 2, which strengthens the assumption that the memory traffic is indeed the cause for this function's high processor consumption.
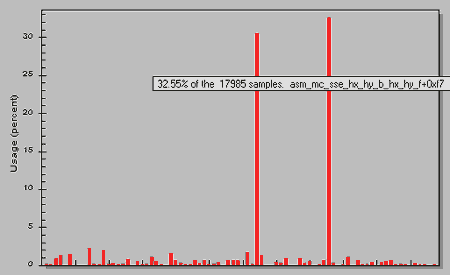
Figure 4. L2 Cache Requests Misses by Location.
Next we'll dive into the source code, identify where these cache misses occur, and determine what data needs to be prefetched. Figure 5 shows the source code (written in inline assembly language in this example). For each source line, you can see the event that you chose to sample; for example, Clockticks, Data Memory References, L1 Lines Allocated, and so on.

Figure 5. Source View before Prefetch.
Total event sums for the whole function are presented in Figure 6. We see that the function required 996Mcycles, that 15.3% of the total L1 data accesses ended with cache line allocation (21993814 / 143329075 * 100), and that most of the accesses to L2 (88.7%) caused a miss.
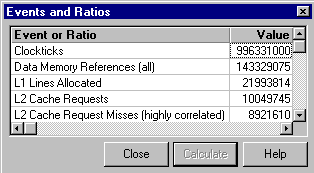
Figure 6. Total Events for Source Function before Prefetch.
Now we are sure that a memory problem causes low performance in this function, and we are ready to optimize using prefetch instructions.
Choose the Right Prefetch Parameters
There are several parameters that will help you optimize your prefetching. Here are suggestions for improving your prefetch performance:
Decide which prefetch to use according to the data locality (temporal or non-temporal).
In the MC example, the data is theoretically accessed only once (and thus it's non-temporal), but since close blocks in a picture often move in the same direction, they use close motion vectors and share reference data. Also, in this case the amount of data is small enough to fit in L1, so PrefetchT0 is suitable. If you have doubts about the locality of the data, try both PrefetchNTA and PrefetchT0.
Choose the prefetch location according to the guidelines in the following section, "Using Prefetches Efficiently". If possible, locate the prefetches in a highly computational section. If that's not possible, spread the prefetches along the loop, even if it is a tight loop.
In our example, the prefetches are spread all over the loop. They are located between computational instructions, always after loads and not before them, thereby avoiding loads stalls.
Choose the prefetch stride: 32, 64, and so on, bytes ahead. Use the stride needed to fetch the data for the next one or two iterations. Prefetching too many iterations ahead generally will not provide any benefit.
In the MC example, prefetching one iteration ahead is sufficient. Note that due to the misalignment characteristics of this example, we dispatch two prefetches to guarantee a hit. This can be better tuned in code that detects DCU line splits to prefetch more efficiently.
Now iIntegrate the prefetch instructions with the chosen code.
With these steps taken, observe the impact of the optimization. Of most importance is the cycle count. Figure 7 shows clocktick distribution by location. The former high peaks of 32% are now normalized around 10-15%. Also note that the overall (application level) performance boost, which in our example dropped from 2395 samples to 1474 samples – a 38.5% performance improvement overall.
Make sure you verify that other routines were not affected badly by the optimization. While this is not relevant in this small example, remember the old saying, "when the blanket is too short, warming the shoulders may lead to cold feet!" In other words, if a so-called optimization of one aspect of your game significantly hurts your game in another area, it's obviously no solution to your problem.
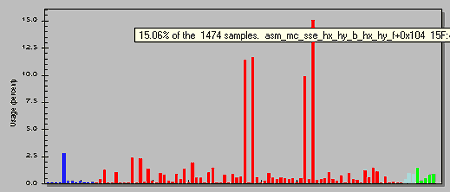
Figure 7. Clockticks Hotspots by Location, After Prefetch.
Looking at the function's total events in Figure 8, we see that the cycle count for the whole function dropped from 996Mcycles to 591Mcycles, which is 40.6% improvement for this function. (The number of data accesses increased due to adding the prefetch instructions.) Note that the cache misses for L1 and L2 did not change much (since the prefetch still causes a miss), but now its latency is hidden.
The Pentium III processor offers special performance monitoring events for counting dispatched prefetches and prefetches that missed the caches. These events can also validate that the number of dispatched prefetches is what you expected, and that most of the prefetches miss the caches. These events are fairly accurate, and help avoid those difficult-to-find prefetch bugs.

Figure 8. Total Events for Source Function After Prefetch.
We already zoomed into the source code and saw line-by-line information. We can get more detailed information with a disassembly view per line. Let's analyze a small section before optimization (Figure 9) and after optimization (Figure 10). The event location distribution changed from one major location immediately after the loads (350Mcycles) into two minor locations (65Mcycles and 99Mcycles).
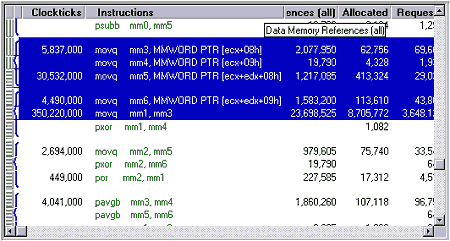
Figure 9. Disassembly View – Zooming into Small Code Section, Before Prefetch.

Figure 10 - Disassembly View – Zooming into Small
Code Section, After Prefetch.
The total events count for these two sections show the full picture (Figure 11 and Figure 12). For this small section of code, the clockticks decreased by 56.3%. Notice that allocation of L1 lines dropped by 12.5%, and L2 misses decreased by 25.3%, because this section does not include the prefetch instructions.
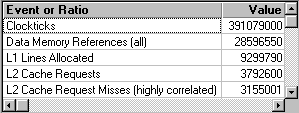
Figure 11. Events Sum of Small Section, Before Prefetch.
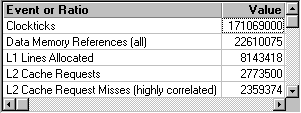
Figure 12. Events Sum of Small Section, After Prefetch.
Other Features and Tools
At the time of this writing, Intel is making it easier to optimize with prefetches for both the VTune Performance Analyzer and the Intel C/C++ Compiler[5]. The importance of the new prefetch instructions with the Pentium III processor is tremendous. Video encoding and decoding, 3D engines, speech recognition, and other applications for the PC will greatly benefit from the integration of the new memory-streaming instructions that the Pentium III processor architecture offers. And once you begin using these instructions, you'll gain even higher performance by understanding their impact on the performance of the whole application. Using the VTune Performance Analyzer you can easily find the optimal configuration for the whole prefetches optimization, and you may be able to achieve some significant performance increases in your game.
More Information
[1] - Pentium III Processor:
Overview, application notes, development tools, drivers and utilities, manuals, and more located at http://developer.intel.com/design/
PentiumIII
[2] - Intel Software Performance Products:
VTune Performance Analyzer, Intel C/C++ Compiler, Intel FORTRAN Compiler, Intel Performance Library, Intel Architecture Tutorials, application notes and more are at
http://developer.intel.com/vtune
[3] – Intel VTune Performance Analyzer:
http://developer.intel.com/vtune/analyzer
[4] - Intel Architecture Tutorials:
See http://developer.intel.com/vtune/cbts/index.htm
[5] - Intel C/C++ Compiler:
http://developer.intel.com/vtune/icl/index.htm
[6] - Programming Utilities, Drivers and Other Software:
http://developer.intel.com/vtune/drvrs.htm
[7] - Pentium III Processors Manuals:
Intel Architecture Software Developer's Manual and the Intel Architecture Software Optimization Reference Manual
http://developer.intel.com/design/PentiumIII/manuals
[8] - Intel Streaming SIMD Extensions Application Notes:
http://developer.intel.com/vtune/cbts/strmsimd/appnotes.htm
Ornit Gross has a B.Sc. (1997) in computer science from The Technion - Israel Institute of Technology. Her areas of concentration are enabling MPEG Video and Speech Recognition in software only. Formerly she co-developed the first SoftDVD and SoftDTV Decoders, and MPEG-2 Encoder. Ornit currently works in the Media Team at Intel's Israel Design Center (IDC) in Haifa, Israel. She can be contacted at [email protected].
Read more about:
FeaturesYou May Also Like