Trending
Opinion: How will Project 2025 impact game developers?
The Heritage Foundation's manifesto for the possible next administration could do great harm to many, including large portions of the game development community.
In this Intel-sponsored feature, Sergey Vorsin, lead programmer at Neoqb, presents a case study on how Intel Graphics Performance Analyzers helped significantly improve the speed and performance of Rise of Flight: The First Great Air War.

Sponsored by Intel
[In this Intel-sponsored feature -- introduced by Intel's Orion Granatir -- Sergey Vorsin, lead programmer at Neoqb, presents a case study on how Intel Graphics Performance Analyzers helped significantly improve the speed and performance of Rise of Flight: The First Great Air War.]
Combat flight simulation games are awesome. Where else can you tear up the sky at full throttle, machine guns blazing, wind roaring, warp speed rearranging your face … and be in the relative safety of the living room sofa? C’mon… be honest.
Like them or LOVE THEM, game companies know that flight sim fans crave the need for speed. In fact, they demand it. And that means tip-top performance and high frame rates.
In this article, I’m tipping my flying goggles to Sergey Vorsin, lead programmer at Neoqb, as he presents a case study on how Intel Graphics Performance Analyzers helped significantly improve the speed and performance of Rise of Flight: The First Great Air War.
The article includes some nice details and data points, as well as screen shots of the tool’s interface to give you context. If you prefer a PDF version, you can download the PDF now (It’s 1.6 MBs). Enjoy! – Orion Granatir.

Neoqb is a young, creative Russian game development company which recently created a modern combat flight simulation game, Rise of Flight has merited international success and critical praise, reaching more than 80 countries around the world.
As a lead programmer at Neoqb, I share my experiences using Intel Graphics Performance Analyzers (Intel GPA) to find rendering pipeline bottlenecks and optimize game performance.
Two scenes were the target for my optimization efforts. After analyzing a frame from the first scene with Intel GPA, performance was increased nearly 70% for that frame, from 41 frames per second (fps) to 69fps. Similarly, the second scene improved 55%, from 40fps to 62fps.
After completion of Neoqb's game optimization using Intel GPA, Rise of Flight now runs about 15% faster across the board, with some components running nearly 50% faster.
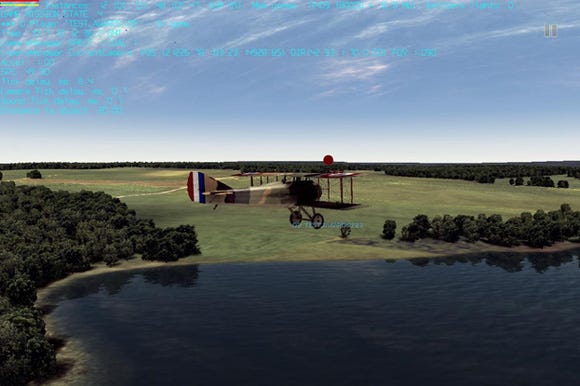
Figure 1. Test Scene for Analyzing System Performance
My first step in the analysis of Rise of Flight was to select a representative scene from the game. I chose a scene with average complexity where all the parts of the graphics pipeline, including the most graphically intensive, were involved (Figure 1).
In this example, the terrain/landscape, an aircraft, and three levels of detail (LODs) are visible: the forest, a river with reflections, and sky with clouds. To isolate the rendering routines' underlying frame rate, I conducted the analysis while the simulation engine was paused, which removed any effect of the simulation threads on the graphics threads.
To analyze performance with Intel GPA, I used a configuration of two PCs: the analysis machine for running the game used an Intel Core™ 2 Duo CPU with an NVIDIA GeForce 8800GTX graphics card and Microsoft Windows XP as the operating system, and the other was a client machine for running Intel GPA tools.
The client PC was linked to my analysis machine through a standard TCP/IP network. The target screen resolution was set to 1200 x 800 pixels, and I set all graphics settings and post-processing effects in Rise of Flight to the maximum, except for target multi-sampling.
The initial frame rate averaged 41 frames per second, which is quite playable. However, it is important to remember that PC gamers represent a wide range of graphics hardware, from high-end video cards to integrated graphics. Therefore, Neoqb chose to further optimize Rise of Flight performance to expand our potential user base while helping to improve our customers' overall game experience.
Neoqb used portions of the performance analysis process described in Practical Game Performance Analysis Using Intel GPA. Here are some initial data points collected by Intel GPA System Analyzer (Figure 2).
The average frame rate: 41 FPS
Draw calls per frame: 262
DX IB Locks per frame: 1
DX VB Locks per frame: 1
Render Target Changes per frame: 317
DX State Changes per frame: 11205
DX State Captures per frame: 830
DX State Applies per frame: 830
DX Surface Locks per frame: 0
DX Surface Updated per frame: 0
DX Stretch Rects per frame: 1

Figure 2. Intel GPA System Analyzer
In Intel GPA Frame Analyzer (Figure 3), the "ERG Visualization Panel" in the top half of the window showed what portions of the frame used the most GPU time. I then selected the set of graphics primitives shown in Figure 3 (highlighted in yellow), which corresponded to the drawing of the plane's fuselage. This tool also indicated that the drawing time for the fuselage was ~215 milliseconds (ms), which was a longer rendering time than I expected.
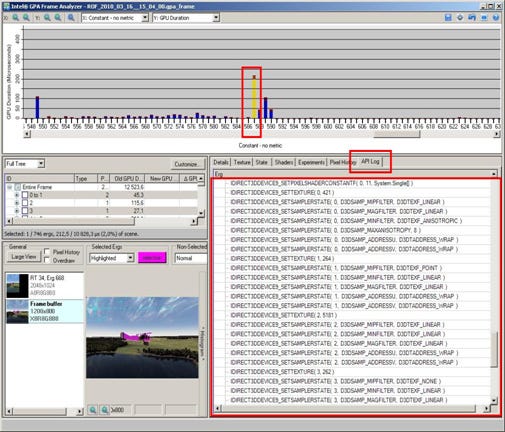
Figure 3. API calls before optimization. Overall rendering time ~215MS
To get a better picture of exactly what was happening, I used the API Log tab within the tool to examine the sequence of DX API calls for these primitives. Also, when running Intel GPA System Analyzer I saw that the state changes (DX State, DX State Captures, DX State Applies, and Render State) per frame were unreasonably high, so I decided to start my optimization efforts with the rendering of the fuselage.
The first optimization step was to reduce the time spent saving and restoring the state information. Neoqb wrote our own state manager (ID3DXEffectStateManager), which allowed us to minimize state changes. After implementing the new state manager, the API Log showed significantly fewer API calls and state changes. The new result was the frame rate increased from 41 FPS to 56 FPS, an improvement of ~37%. Next, I performed additional pruning of the Render State changes used by effects such as bloom and high dynamic range rendering (HDR). The bottom line is that I was able to achieve 69 FPS, an overall improvement of ~60% from when I first started analyzing the frame within Intel GPA Frame Analyzer (Figure 4).
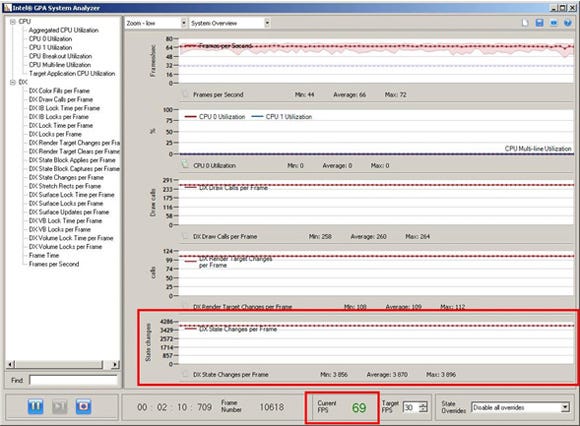
Figure 4. After optimization of RenderState changes and RenderTarget changes
After completing the analysis using Intel GPA System Analyzer, I ran Intel GPA Frame Analyzer on the test scene (Figure 5). Key observations were:
Ergs 69 - 71 highlight a GPU spike due to a slow pixel shader rendering for the surface terrain (~ 1 ms)
Ergs 588 - 591 highlight another GPU spike due to the rendering of an aircraft model which has a complicated pixel shader (~ 0.4 ms)
Ergs 670 - 728 highlight a third GPU spike due to the rendering of various optional effects such as bloom and HDR (~ 3.6 ms)
The rest of the GPU time is spent rendering the landscape (~ 3.7 ms) and dynamic depth-shadows (~0.2 ms)
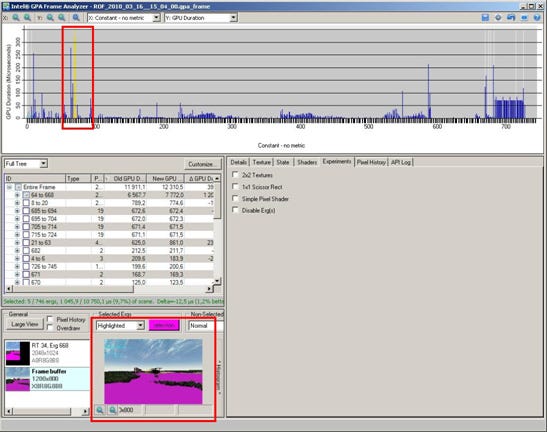
Figure 5. Test scene rendering times
The "Shaders" tab of the Intel GPA Frame Analyzer showed that the terrain pixel shader and the aircraft pixel shader used many instruction slots and textures, so I created a streamlined version of the pixel shader with reduced texture lookups and instruction slots. Similarly, the aircraft pixel shader also used many instruction slots.
The shader was compiled with Pixel Shader (PS) 2.0, which does not support branching. By using PS 3.0, I was able to rewrite the shader and optimize it with static branching for multiple lighting. After these changes, I carefully analyzed the overall visual quality of the scene to ensure that the end result was still visually compelling.
Having completed optimization of the first scene, I switched to analyzing the landscape rendering. As shown in Figure 6, the game renderer spent most of its time in landscape rendering (54%), so I took a closer view of the terrain/landscape rendering system by using a separate application (RoF Editor) which only rendered the landscape.
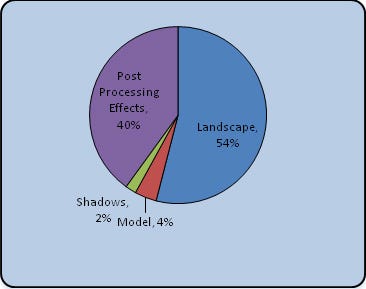
Figure 6. Test frame time distribution diagram
For test purposes, I chose the slowest possible scene, which occurs when the viewpoint is selected such that all objects in the landscape are rendered. The frame rate for this viewpoint dropped to ~40 FPS (compared to a viewpoint 400 feet above the ground, where the frame rate increased to ~100 FPS).
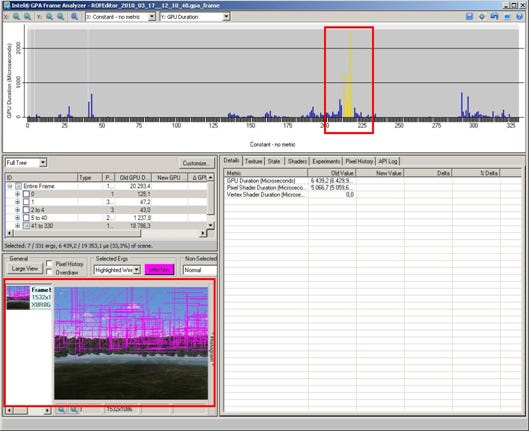
Figure 7. Close-up view of landscape (~40 FPS)
The peak GPU time occurred when rendering trees in frames 215 - 219 (~ 6.4 ms).
Terrain rendering occurred in frames 40 - 44 (~ 1.2 ms)
Grass rendering occurred in frames 290 - 316 (~ 3.2 ms)
Rise of Flight's forest rendering process was quite complex and required considerable CPU and GPU resources. The size of a forest "chunk" is 667 by 667 feet, and the rendering engine culled non-visible chunks from the forest map database.
Although these trees are invisible to the viewer, they are still rendered at a high level of detail. To optimize tree rendering, I rewrote the shader to use dynamic branching within PS 3.0 to utilize a high-detail forest mask. As a result I improved tree rendering times ~50%, increasing the frame rate for the terrain render test case from 41 to 62 FPS.
Grass rendering was the final area highlighted as being slow by Intel GPA. Since this is an optional feature, the user can choose to lower the quality of grass rendering or turn it off completely.
The initial version of Rise of Flight was playable on many graphics systems, but Neoqb wanted to see whether we could improve rendering performance and provide an enjoyable flight simulator across a broader range of graphics devices.
First, I used Intel GPA System Analyzer to optimize the performance of the Rise of Flight game rendering engine. Secondly, I generated a typical game test frame and used Intel GPA Frame Analyzer to identify and optimize the slowest parts of the rendering.
In the final step, I tested the rendering speed of the landscape rendering engine, and found that the forest rendering system was implemented with a slow pixel shader. By rewriting the pixel shaders to use PS 3.0 with dynamic branching, additional performance gains were accomplished without degrading the overall visual effect for the user.
Finally, Intel GPA has also helped identify additional areas for future enhancements. When more time becomes available, Neoqb plans to simplify the terrain pixel shader, and rewrite the pixel shaders to utilize PS 3.0's static branching to optimize model rendering.
Intel GPA helped Neoqb identify several key performance bottlenecks, which allowed the development team to focus on fixing the most critical performance issues. After optimizations, overall game performance improved ~15% across the board, and in some cases the frame rate increased by more than 50%.
My overall impression of Intel GPA is that Intel's Graphics Performance Analyzers suite is simple to use, and is an informative toolkit for render-pipeline adjusting, performance optimization and debugging. Intel GPA proved its use, and helps us to speed up the debugging process and increases our efficiency.
For more information on Rise of Flight, go to http://riseofflight.com/en. For more information on Neoqb, go to http://www.neoqb.com/en/.
You May Also Like